
Sales Metrics: The Most Important KPIs in the Sales Process


Sales has always been the heartbeat of any business — from small family-owned companies to global enterprises. But managing sales effectively takes more than just a “feel for the market” or relying solely on your sales team’s intuition. You need concrete data to measure, analyze, and improve performance.
That’s where sales metrics come in — a set of key performance indicators (KPIs) that reflect the effectiveness of your sales process at every stage.
Where Did Sales Metrics Come From?
While tracking sales performance may seem like a given today, the idea has its roots in the Industrial Revolution. With the rise of scientific management, companies began systematically studying and optimizing sales activities to gain a competitive edge (Taylor, Principles of Scientific Management, 1911).
In the 1950s, Peter Drucker further developed the concept of metrics in business, famously stating, “What gets measured, gets managed” (The Practice of Management, 1954).
What Are Sales Metrics and Why Do They Matter?
Sales metrics are measurable numerical values that reflect the outcomes of sales activities over a specific time frame. Put simply: these are the numbers and ratios that show how much you sold, how many customers you served, how many opportunities you generated, and how efficiently your team met its goals.
According to W. J. Stanton, M. J. Etzel, and B. J. Walker (Fundamentals of Marketing, McGraw-Hill, 1994), “Sales metrics are the quantitative record of the effectiveness of a company’s marketing and sales efforts during a given period.”
That means metrics can include both hard financial data (like total deal value or average transaction size) and softer activity-based indicators (like the number of meetings held, average response time, or customer retention rate).
Why Are Sales Metrics Important?
Sales metrics are essential for several reasons:
- They show where you stand. Metrics let you assess your current sales effectiveness and compare results against your goals.
- They help diagnose problems. If one stage of the sales funnel is underperforming (e.g., many leads but few closed deals), the metrics will expose it quickly.
- They support planning and forecasting. Historical data helps you estimate which actions are likely to bring desired results in future months or quarters.
- They motivate your team. Visible results and comparisons — either to targets or to other teams — often drive better performance among sales reps.
That said, not every sales metric should be treated as a goal in itself. It’s critical to select KPIs that align with your business strategy and interpret them correctly.
Otherwise, it’s easy to fall into the trap of so-called “vanity metrics” — numbers that may look impressive but offer little insight into actual performance or impact.
The Difference Between KPIs and Sales Metrics
In business practice, the terms KPI (Key Performance Indicator) and sales metrics are often used interchangeably. While they are closely related, they are not the same thing. Understanding the difference is essential to effectively managing the sales process — and to avoid getting lost in a sea of data.
Sales Metrics – A Broad Category
Sales metrics include all numerical data that helps you measure the results of your sales activities. These can be simple, operational numbers such as:
- number of proposals sent,
- number of sales calls made,
- total sales value in dollars,
- average sales cycle length,
…as well as more advanced metrics around customer relationship quality or client retention.
In short, sales metrics reflect what’s happening in your sales process and what outcomes are being generated. But not all of them are equally important when it comes to achieving your company’s strategic goals.
KPIs – The Key Few That Really Matter
KPIs, or Key Performance Indicators, are a subset of your sales metrics — the ones your organization has identified as most critical to reaching its business objectives.
According to Robert S. Kaplan and David P. Norton, creators of the Balanced Scorecard, KPIs are “those indicators that have the greatest impact on the success of the company’s strategy and are so critical that their non-achievement equals failure” (The Balanced Scorecard, 1996).
In practice, this means:
- All KPIs are sales metrics,
- But not all sales metrics qualify as KPIs.
KPIs are those metrics that guide decision-making, align teams with strategic goals, and define what success looks like for the business.
How to Communicate Sales Metrics to the Sales Team
Measuring performance is only part of the equation — how you communicate these metrics to your sales team is just as important. Metrics should be clear, relevant, and tied to the company’s goals. Salespeople need to know not only what is being measured, but why — and how it impacts their day-to-day work.
Instead of overwhelming your team with dozens of figures, focus on a few meaningful KPIs that truly reflect performance. Present them regularly — during weekly sales meetings or on visible dashboards — and show how hitting those KPIs connects directly to bonuses, promotions, or overall company success.
It’s also important to allow space for questions and discussion. When metrics are not seen as arbitrary evaluations, but rather as tools for growth and direction, your team is more likely to engage with them and view them as guides, not controls.

Measuring Sales Metrics in Practice
In theory, measuring sales metrics sounds simple — just gather data and run the numbers. But in practice, many companies struggle: the data is scattered, outdated, or the metrics being tracked don’t actually align with real business goals.
The first step is to determine which metrics truly matter for your specific sales process. For example:
- In B2B companies with long sales cycles, key metrics might include sales cycle length, number of meetings, or pipeline value.
- For a call center selling insurance, metrics like call volume and conversion rate are far more relevant.
How to Get Started – Step by Step:
- Centralize your data.CRM tools like Salesbook are invaluable here — they collect and update sales information automatically and in real time.
- Set your measurement frequency.Some metrics should be tracked daily (e.g., number of new leads), while others make more sense on a quarterly basis (e.g., customer retention).
- Compare your results to benchmarks.Use internal standards (e.g., best team result from the previous quarter) or external industry benchmarks to set performance expectations.
- Analyze trends — not just single data points.A one-time dip might be irrelevant. But a downward trend? That’s something you need to act on.
Investing time in data visualization also pays off. Dashboards, charts, and simplified reports help teams quickly grasp what’s going on and respond faster. According to Forrester Research, companies that use interactive dashboards report a 12–20% increase in sales team productivity.
But most importantly, measuring sales metrics should never be a checkbox task. It should become a core element of your company culture — one that informs decisions and drives the growth of the entire team.
Key Sales Performance Indicators – An Overview of What Really Matters
To properly assess the effectiveness of your sales process, it’s not enough to look at total revenue. You need to dig deeper into sales metrics that reveal not just how much was sold — but how it was achieved, how efficiently, and what it means for the future.
This section highlights the most commonly used sales metrics in practice — the ones that empower you to manage your sales reps and strategy with clarity and confidence.
Customer Acquisition Cost (CAC)
One of the most critical sales metrics — especially when it comes to optimizing marketing expenses and scaling effectively.
To calculate CAC, divide your total sales and marketing team spend over a fixed period by the number of new customers acquired. A low CAC means you’re running efficiently. A high CAC signals that it’s time to re-evaluate your sales tactics, content strategy, or lead generation efforts.
Customer Lifetime Value (CLV)
Customer Lifetime Value (CLV) shows the total revenue generated by a single customer over the course of their relationship with your company.
This metric is essential for understanding how much you can afford to spend on acquiring and retaining customers. Comparing CLV to CAC is a powerful way to track long-term profitability — especially for subscription-based models with monthly recurring revenue (MRR).
Monthly Recurring Revenue (MRR) and Annual Recurring Revenue (ARR)
For SaaS and service-based businesses, monthly recurring revenue and annual recurring revenue are key leading indicators of financial health.
These metrics provide a predictable view of your income stream and help sales leaders plan for sustainable growth. Tracking MRR also reveals the impact of upgrades, downgrades, and churn — all critical for managing your existing customers effectively.
Conversion Rates
A staple among sales KPIs, conversion rates measure the percentage of leads that progress from one stage of the sales funnel to the next (e.g., from lead to closed deal). Monitoring conversion at each stage helps you identify where potential customers drop off — and where your team needs to improve.

Average Revenue per Customer and Average Purchase Value
Understanding average revenue and average purchase value helps you spot trends in buyer behavior and opportunities for upselling.
If your average profit margin is strong but purchase values are declining, it might be time to review bundling strategies or refine your pricing model. These insights are especially useful when comparing segments of new vs. existing customers.
Number of Deals and Monthly Sales Bookings
The number of deals closed in a given timeframe (week, month, or quarter) is a basic yet essential KPI.
Pair this with monthly sales bookings — the total value of new deals added to your pipeline — and you’ll get a clear view of how your sales representatives are contributing to growth. This is also where sales productivity metrics come into play.
Sales Velocity and Sales Pipeline Efficiency
Sales velocity measures how quickly leads move through your sales pipeline — from initial contact to closing the deal.
A sluggish pipeline often means there are blockers in your process, whether in lead qualification, negotiation, or final decision-making. Streamlining pipeline stages with the right sales tools can improve speed and drive better sales team performance.
Forecasting Future Revenue
Not all sales metrics are backward-looking. Forecasting future revenue — based on pipeline data, customer history, and conversion metrics — is becoming increasingly important. With accurate forecasting, sales managers can plan resources more effectively and set achievable targets.
Customer Response Speed
In an era of rising customer expectations, response time is a crucial KPI. The speed at which your sales team responds to inquiries directly affects customer experience, retention rates, and cross-sell opportunities. Even a small delay can mean the difference between a sale and a lost lead.
Tracking Sales Metrics Over Time
Tracking sales metrics isn’t a one-time task — it’s an ongoing process that allows sales and marketing teams to identify patterns, optimize campaigns, and improve conversions.
Looking at monthly sales growth or sales revenue trends over time also enables you to track progress against your strategic goals and respond proactively to shifts in the market.
How Many Sales Metrics Should You Track?
There’s no universal number, but the answer is: not too many, not too few. Focus on a core set of leading indicators that align with your business model, team size, and growth stage.
With the right metrics — from customer acquisition cost to recurring revenue, from CLV to monthly bookings — you’ll turn data into action and empower your sales and marketing teams to generate lasting results.
Evaluating Sales Effectiveness – How to Interpret Sales Data
Tracking numbers is only the first step. Real value comes from interpreting those numbers correctly and using the insights to improve your team’s performance. To accurately evaluate the effectiveness of your sales process, you need to look beyond the final results and understand how each stage contributes to the overall outcome.
One of the most basic — yet critical — indicators is the number of new customers acquired during a specific period. Your revenue might be high, but if you’re not acquiring new clients, your company risks losing market share over time. That’s why it’s essential to monitor this metric continuously and compare it with your customer acquisition costs to assess the efficiency of your sales efforts.
Another useful indicator is the sales coverage ratio, which shows how the total value of current sales opportunities in your pipeline compares to your sales target for the same period. If the ratio is below 1, it signals that your funnel lacks enough opportunities to meet the goal — and corrective actions are needed.
Sales KPIs such as the deal closing rate also provide valuable insights. This metric shows what percentage of opportunities convert into signed contracts within a given timeframe. A low closing rate might indicate problems during the final stages of the sales conversation or weaknesses in your offer structure.
In practice, sales managers should regularly analyze both quantitative and qualitative data to draw meaningful conclusions and implement targeted improvements. This kind of sales data analysis enables faster responses to shifts in customer behavior, market dynamics, or team performance.
It’s important to remember that key sales metrics — such as new customer acquisition, closing rates, and sales coverage — are interconnected. Focusing on one while ignoring the others may yield short-term gains but won’t lead to sustained sales growth or long-term business success.
How to Use Sales Metrics to Improve Sales Team Performance
Numbers alone don’t drive change — it’s the actions you take based on those numbers that make the difference. That’s why sales performance measurement should never be treated as a passive reporting task, but as an active strategy to improve sales team performance and drive measurable results.
In practice, this means regularly reviewing your sales data — not just for the sake of record-keeping, but to gain strategic insight. Compare current results with past performance to identify where improvements are needed. For instance, if your monthly sales bookings or number of deals drop significantly, it may signal the need to adjust your lead generation strategy or revisit your nurturing tactics.
If deals are being lost late in the funnel, consider enhancing your close-stage sales tactics or providing additional training for your team. Look at how each step of the pipeline contributes to — or hinders — your monthly sales growth.
Linking Metrics to Profitability and Long-Term Revenue
Understanding cost-efficiency is essential. By comparing the average cost per lead or customer to the total revenue generated, you’ll quickly see if your sales and marketing spend is delivering ROI.
If acquisition costs go up while deal sizes shrink, it may be time to rethink your positioning or value proposition. Tracking annual recurring revenue and company revenue also gives you a high-level view of long-term sustainability, particularly in subscription-based or SaaS models.
Focus on Retention and Customer Satisfaction
Customer satisfaction metrics are just as vital as revenue KPIs. High churn or negative feedback may be limiting your ability to grow your total revenue — no matter how many new customers you acquire.
Retention is one of the most powerful revenue drivers. Satisfied customers are more likely to expand contracts, refer others, and renew — directly contributing to annual recurring revenue and boosting the lifetime value of your client base.
Identify Bottlenecks and Remove Friction
A smooth sales pipeline is essential for growth. If one stage consistently slows down your process, dig into the data to uncover what’s happening. Are reps waiting too long for approvals? Are leads stalling at the proposal stage?
With proper sales performance measurement, you can pinpoint these issues and optimize the process to track progress more accurately and reduce time to close.
From Metrics to Action: Make Data Work for You
At the end of the day, sales metrics are not just a mirror but your GPS. Use them to navigate toward your goals, make smarter decisions, and outperform the competition.
Whether you’re tracking monthly sales growth, total revenue, or customer satisfaction metrics, the key is to connect the dots between data and action. That’s how the best organizations improve sales efficiency and scale their revenue — month after month, year after year.

Most Common Mistakes in Sales Metrics Analysis
Even the best data won’t help if it’s misunderstood. Interpreting sales metrics incorrectly is one of the fastest ways to derail your strategy — and unfortunately, it happens more often than you think.
1: Treating Metrics as Vanity Numbers
Sales metrics are not meant to decorate dashboards. Yet many sales managers fall into the trap of reporting numbers without fully understanding what they mean. A metric is only valuable when it directly supports decision-making — not when it just looks impressive in a monthly report.
2: Measuring Too Much — and Seeing Too Little
Trying to track everything at once is a recipe for confusion. When reports are packed with dozens of metrics, it becomes harder to detect meaningful trends. Instead, focus on a select group of high-impact metrics that truly reflect your sales team’s performance.
Split your data into tactical metrics (e.g., number of calls, meetings booked) and strategic metrics (e.g., customer retention rate, customer lifetime value). Then, prioritize the latter in your core analysis — they tell the real story.
3: Ignoring the Bigger Picture
Numbers don’t exist in a vacuum. A dip in sales during a particular month might not indicate a performance issue — it could be seasonal fluctuation, a new product launch from a competitor, or changes in customer behavior.
Without context, you risk making the wrong call. Always consider market conditions, competitor actions, and internal factors when interpreting sales results.
4: Overlooking Qualitative Indicators
While sales reports often focus on hard numbers, qualitative factors like customer satisfaction and feedback play a critical role in long-term performance. If you ignore them, your metrics might say you’re winning — while customers quietly leave after their first deal.
Balance quantitative analysis with qualitative insights to avoid blind spots that can hurt retention and reputation.
5: Tracking the Wrong Metrics
Not every KPI deserves your attention. Some metrics are only valuable if they align with your sales model and business goals.
For example:
- Average customer acquisition time is useful in enterprise sales but may not matter in fast-paced B2C environments.
- Ad conversion rates only matter if paid campaigns play a real role in your lead generation funnel.
The rule is simple: if a metric doesn’t inform action or tie directly to your sales objectives — skip it.
6: No Follow-Up After the Analysis
The worst mistake? Doing nothing with your insights.
Sales metrics analysis isn’t just about identifying what’s wrong — it’s about fixing it. After every reporting cycle, pinpoint 2–3 priority areas and define specific steps to improve them. That’s how real growth happens.
From Insight to Impact
Consistent performance in key sales metrics — such as conversion rate, retention, customer satisfaction, and sales revenue — isn’t luck. It’s the result of intentional, context-driven analysis and action.
Focus on the right sales metrics, interpret them wisely, and treat every data point as a stepping stone toward smarter sales strategy and long-term growth.
Tools That Support Measuring Sales KPIs
To effectively measure and analyze key sales metrics, companies need the right tools that automate data collection and present insights in a clear, actionable format.
Manual tracking in spreadsheets quickly becomes insufficient—it’s time-consuming, prone to errors, and makes agile decision-making difficult.
Salesbook – A Comprehensive Tool for Sales Teams
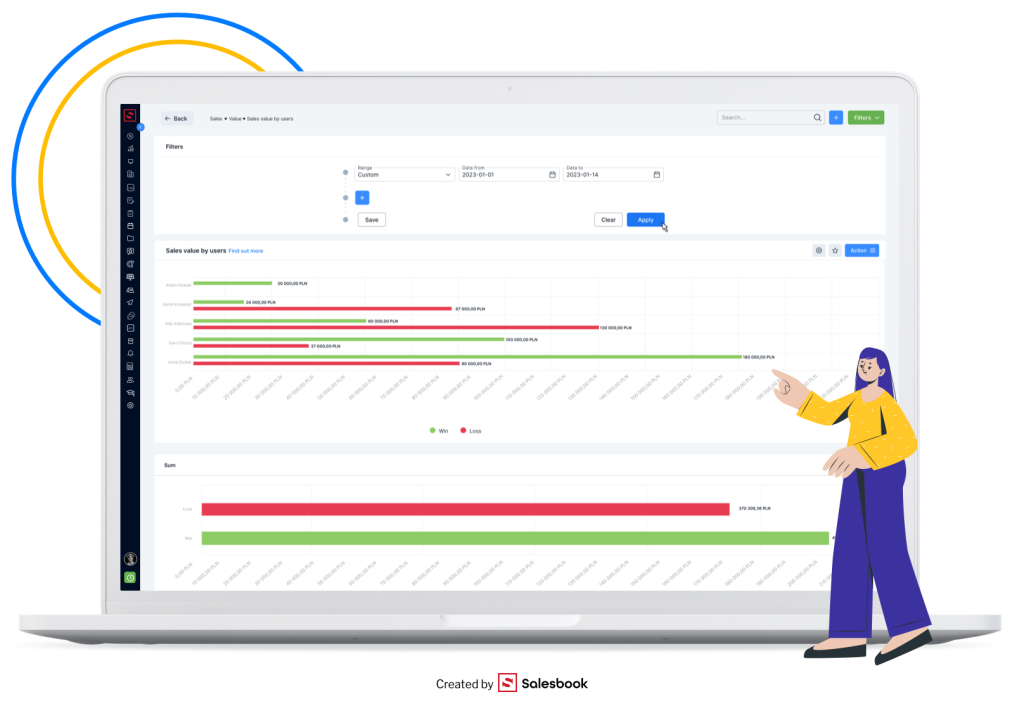
Salesbook is an advanced CRM system designed from the ground up to support salespeople in every step of the sales process while giving managers access to real-time, reliable data.
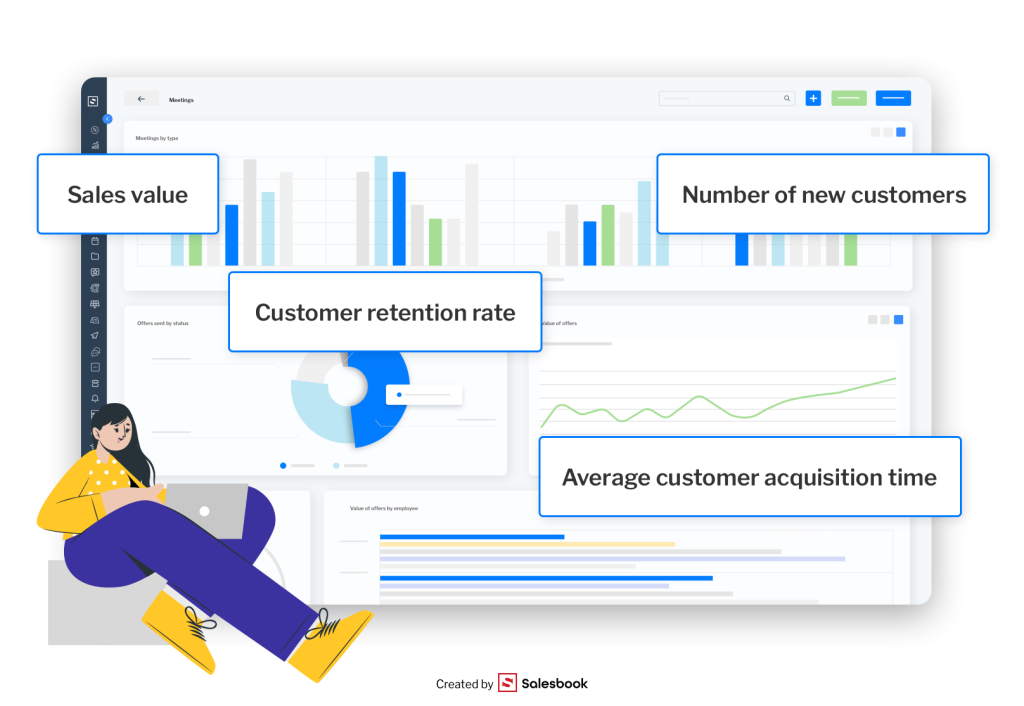
With built-in reporting modules, users can track critical KPIs across every stage of the pipeline—from the number of new customers and average time to close a deal, to pipeline value and deal-closing ratios.
Salesbook also enables you to:
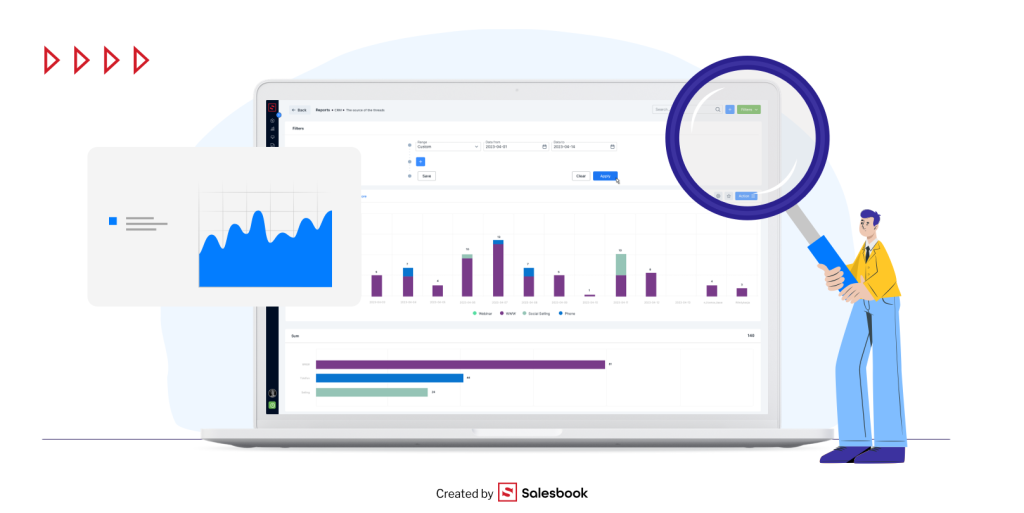
- Generate detailed reports on the effectiveness of specific sales activities
- Analyze trends via clear, customizable dashboards
- Compare performance across individual reps and sales teams
- Monitor customer retention rates and conversion metrics across the pipeline
This platform is particularly valued in industries where the sales process is relationship-driven, complex, and requires understanding customer needs at various stages.
Additional Tools for Deeper Sales Analysis
In combination with Salesbook, teams can also leverage dedicated data visualization and analysis tools that complement CRM systems rather than compete with them. These include:
- Microsoft Power BI – for advanced dashboards and data visualizations
- Google Data Studio (Looker Studio) – a free platform for creating dynamic, multi-source reports
The biggest advantage of modern tools like Salesbook is the ability to gather data automatically, keep it up to date in real time, and access it anywhere—via desktop or mobile. This minimizes the risk of errors and allows teams to focus on what truly matters: smart interpretation and action.
Which Sales Metrics Should You Monitor?
Sales metrics are the foundation of effective sales management — they help you evaluate performance, identify bottlenecks, and make smarter decisions. But to truly benefit, you need to track the indicators that directly support your business goals — and analyze them regularly in the context of your team’s actions and market dynamics.
The best results come to companies that not only choose the right KPIs, but also use tools that collect and organize real-time data in one place.
That’s where Salesbook excels — as a modern CRM platform built specifically for sales teams that want to grow based on facts, not assumptions.
Book a free Salesbook demo and discover how it can help you measure and improve your sales performance.
Table of Contents