Sales growth rate. How to calculate it?


In sales, it’s not enough to know how much you’ve sold. Just as important — and often even more so — is knowing how fast you’re growing. After all, is $125,000 in sales this quarter a success? That depends — if last quarter’s result was $75,000, you’re gaining momentum. But if it was $150,000, you’ve got a problem.
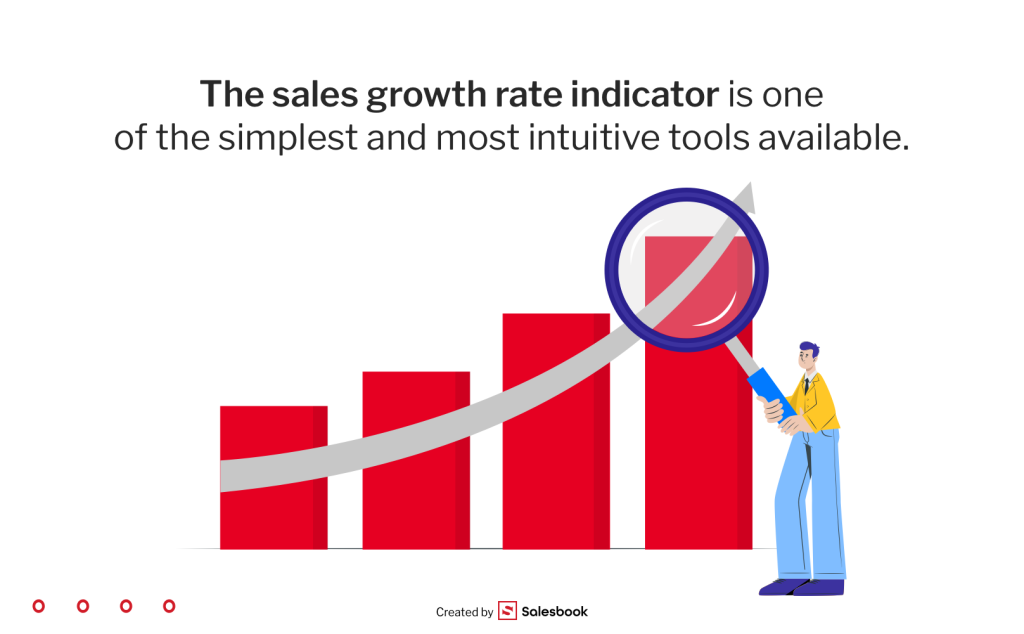
That’s exactly where the sales growth rate indicator comes in — one of the simplest and most straightforward tools to check whether your business is moving forward or standing still. And the best part? It only takes a moment to calculate.
In this article, we’ll walk you through:
- what exactly this indicator is,
- how to calculate it and what is the sales growth formula,
- how to interpret the results and apply them in practice — in analysis, reporting, planning, and optimizing your sales strategies.
No theory overload. Just clear, practical, and actionable insights.
What is and How to Calculate Sales Growth Rate?
The sales growth rate is a percentage that shows how your company’s sales have changed between two points in time. It measures the difference between current period sales and previous period sales, helping you understand whether your business is growing, stagnant, or declining.
In essence, it’s the most direct way to track sales growth and quickly assess business performance. Whether you’re an executive analyzing yearly revenue trends or a sales manager checking monthly results, this metric offers instant clarity.
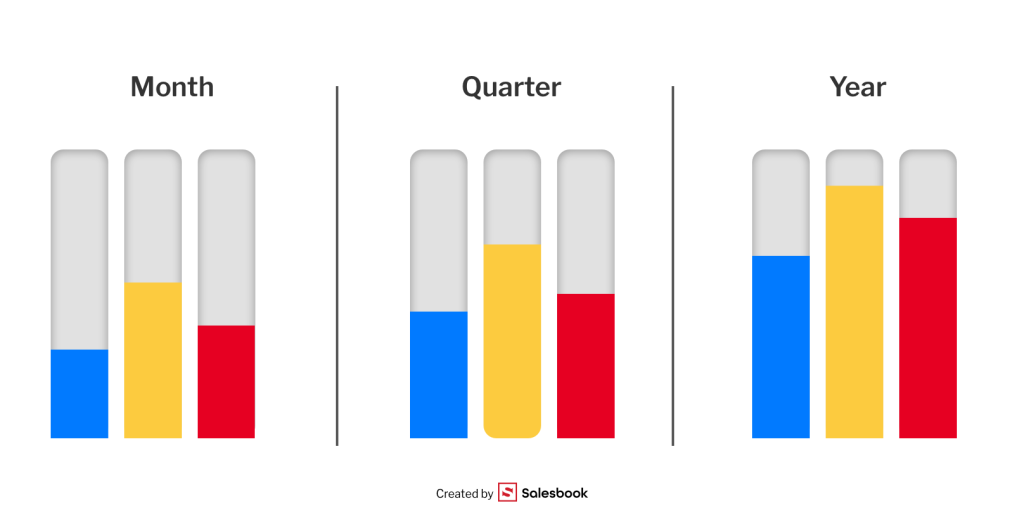
Most commonly, companies use it to compare:
- Month over month (e.g., May vs. April),
- Quarter over quarter (Q2 vs. Q1),
- Year over year (2025 vs. 2024).
By applying the sales growth rate formula, you can objectively evaluate how your sales volume evolves.
Here’s the basic sales growth formula:
(Current Period Sales – Previous Period Sales) / Previous Period Sales × 100%
This calculate sales growth formula is simple, yet extremely effective across businesses of all sizes and industries.
Why Monitoring Sales Growth Rate Matters
Tracking your sales growth rate regularly isn’t just a best practice — it’s a necessity for data-driven decision-making. Here’s why it matters:
- It’s a core tool for analyzing long-term sales growth, identifying both positive and negative trends.
- It helps teams calculate sales growth accurately and react quickly to market changes.
- It serves as an early-warning system for underperformance or a validation point for new strategies.
- It provides a quantitative backbone for budget forecasting, goal-setting, and future growth planning.
Importantly, it’s also a universal benchmark — easy to implement and understand whether you’re a startup founder, sales executive, or enterprise leader. You can apply it across product lines, regions, sales channels, or entire teams.
And if you’re wondering, what’s a good sales growth rate? — it depends on your industry. For mature industries, a sales growth rate of 5–10% may be strong. In fast-growing sectors like SaaS or e-commerce, a higher sales growth rate (20% or more) is often expected.
The indicator is also privacy-friendly. It does not identify any specific user, and when used in tools like CRM or BI dashboards, it operates on aggregated data — making it a secure and compliant choice for performance tracking.

When Is Sales Growth Analysis Used?
Sales growth analysis is one of the key tools for assessing the effectiveness of activities carried out in the sales domain. In practice, it means comparing how sales data changes over time — whether month by month, quarter by quarter, or year over year — and understanding what factors drive those changes.
Companies use this type of analysis in a wide range of scenarios:
- when implementing new sales strategies, to quickly assess their impact on performance,
- when launching new products or making changes to the offer,
- to evaluate the effectiveness of marketing campaigns,
- as part of long-term planning or strategic planning,
- during periodic reviews, such as quarterly or annual summaries.
It’s worth noting that sales growth analysis doesn’t need to be technologically complex. It can be based on simple Excel spreadsheets or integrated into more advanced BI systems.
What’s important is that most of these solutions work with aggregated data, making them safe to use even in environments with high privacy standards.

Common Mistakes in Interpreting the Sales Growth Rate Indicator
Although the sales growth rate indicator is easy to calculate, interpreting it correctly can be surprisingly tricky. Below are some of the most common pitfalls companies fall into — whether they operate in services, e-commerce, or product sales.
1. Comparing incomparable periods
Comparing December to February? Or Q4 to Q1 without accounting for seasonality? That’s a classic mistake. If the periods differ in length or operate under different market conditions, the results can be misleading. In sales growth analysis, context is everything.
2. Ignoring the causes of growth or decline
A raw result — say, 130% — means little without understanding why. Was it due to a one-off contract? Maybe, a pricing change? A system outage? Broader perspective is essential — like combining the indicator with performance metrics or operational efficiency indicators.
3. Overlooking team structure changes
Sales increases or decreases may result from staff turnover, team reorganization, or changes in customer service. Without workforce context, the indicator alone can be deceptive.
4. Basing decisions solely on the bad or good sales growth rate
While it’s a valuable metric, the sales growth rate isn’t a standalone decision-making tool. Best practice is to combine it with other data — like average order value, transaction volume, profit margins, or NPS scores — to gain a full picture.
5. Data errors
It sounds obvious, but inaccurate or outdated sales data can completely distort results. This is especially important in automated reporting — regular data verification is a must to ensure credibility.

It’s important to remember that even the most advanced analytics tools — whether based on dashboards or CRM systems — should be configured with security and privacy in mind. These tools must operate without the ability to download reports that could contain sensitive data or fall under additional regulatory constraints.
Likewise, files used within reporting systems — such as analytical cookies or marketing cookies — should always be used in accordance with applicable regulations and only with the user’s explicit consent.

How to Calculate the Sales Growth Rate Indicator
If you want to check how your sales have changed over a specific period, all you need is one simple tool: the sales growth rate indicator.
Sales growth rate formula:
(Sales in the current period – Sales in the baseline period) / Sales in the baseline period × 100%
This universal formula works whether you’re analyzing monthly, quarterly, or yearly data. It can be used to monitor overall sales value or to assess the impact of a marketing campaign or new product offering.
Example Calculation — A Real-World Sales Scenario for Data Driven Insights
Let’s say Company X launched a new product in April. The sales team wants to assess its impact in May. Here’s the data:
- April: $20,000
- May: $23,000
Sales Growth Rate = (23,000 – 20,000) / 20,000 × 100% = 15%
Conclusion? After launching the product, the company saw a 15% increase in sales.
But to get the full picture, it’s worth looking beyond a single month. Calculating growth rate indexes for several consecutive months helps determine whether you’re seeing a sustainable trend or just a one-time spike.
Step-by-Step: How to Calculate the Sales Growth Rate
- Gather your sales data – Make sure you’re comparing the exact same value types (e.g., net or gross invoice amounts).
- Choose two comparable periods – For example, two consecutive months, quarters, or years. Decide which is your baseline period and which is the current one.
- Apply the formula – Divide the sales value from the current period by the value from the previous one.
- Multiply the result by 100 – This will convert the ratio into a percentage.
- Interpret the result:
- Over 0% = sales growth
- Exactly 0% = no change
- Under 0% = sales decline

What to Watch Out for When Calculating the Sales Growth Rate to Make an informed Business Decisions
- Incomparable periods – Comparing a month to a quarter, or a low season to a high season, can distort the true picture. Always make sure the periods are aligned in length and context.
- Changing market conditions – Inflation, demand shifts, and seasonality can all impact sales trends independently of your sales team’s performance.
- Incomplete data – Missing invoices or reporting delays can throw off your results and lead to inaccurate conclusions.
- Oversimplification – The sales growth rate is just one of many tools. To get real insights, combine it with other metrics like customer churn, profit margins, or campaign performance.
It’s worth noting that modern CRM systems and BI platforms that automatically present sales growth data are often fully compliant with GDPR. These tools typically operate on aggregated data, which means they do not identify any specific user. As a result, companies can safely analyze data from various channels — even those using analytical cookies and personalized marketing content — without compromising user privacy.
H2: What Data Do You Need for a Reliable Analysis?
A well-executed sales growth analysis begins with high-quality, consistent data. To accurately calculate your business’s sales growth rate and make decisions based on facts — not assumptions — you need much more than just topline sales figures.
Context is everything. Whether you’re evaluating retail sales, enterprise accounts, or B2B performance, the sales growth rate only becomes truly meaningful when you understand what’s driving the numbers. Poor or incomplete datasets can mislead your interpretation, resulting in flawed forecasts or ineffective sales growth strategies.
What Should Your Dataset Include?
To evaluate your sales performance and measure the true effectiveness of your efforts, ensure your dataset contains the following elements:
- Net sales or gross sales values from two comparable periods (e.g., Q1 vs. Q2)
– These are the foundation of any sales growth rate calculator or analysis. Consistency in value type is critical — stick to either net sales or gross throughout. - Details about what was sold, including product types, categories, and SKUs
– This helps identify where your positive sales growth is happening and which product lines may be underperforming. - Number of transactions and average order value
– A shift in period sales volume might result from higher transaction counts or simply larger deals. This nuance matters. - Sales channel breakdowns (e.g., online vs. offline, direct vs. partner)
– Rapid business growth in one channel may be masking stagnation in another. Segmenting channels helps you respond strategically. - Team or regional attribution
– Are some regions driving robust sales growth, while others lag? This data is vital for localized planning and resource allocation.
It’s also crucial that each data point refers to the same transaction type and is pulled from comparable time periods. Comparing April to July without adjusting for seasonality, for instance, can produce misleading trends — especially when analyzing annual sales growth rate.
When applied correctly, this data becomes the backbone for more advanced insights using a sales growth calculator, dashboard tool, or internal sales growth rate measures. It also allows you to build scalable models for sustained sales growth across your organization.

Sales Growth Rate vs. Other Key Performance Indicators
The sales growth rate is a critical metric in any performance report — but relying on it alone can give you a narrow perspective. For a comprehensive view of your company’s growth, it must be assessed alongside other key performance indicators (KPIs) that reflect both sales process effectiveness and broader financial health.
To get meaningful insights and truly identify trends, businesses need to look at how growth rate interacts with other dimensions of performance. This approach supports stronger strategic planning and helps leadership make smarter decisions that fuel future growth.
KPI Combinations That Provide Real Insights
Here are some effective combinations of KPIs that go beyond the surface of a positive sales growth rate:
- Growth rate + drop in gross margin
→ You may be generating more sales revenue, but earning less per sale. This could indicate over-discounting, poor cost control, or margin erosion that threatens company’s financial health. - Growth rate + lead conversion rate
→ Helps determine whether increased sales are the result of your sales reps working more efficiently, or simply a volume game. A higher conversion rate usually reflects an optimized sales process and better customer relationship management. - Growth rate + churn rate
→ Rapid sales growth can look great — until you realize you’re losing customers as quickly as you gain them. High churn undermines sustained growth and signals issues with onboarding, support, or long-term value delivery.
When used in combination, these metrics allow companies — especially established companies — to identify trends early, compare against industry benchmarks, and understand what’s really driving or hindering performance.

Growth vs. Profitability – Understanding the Difference
Many junior managers mistakenly equate sales growth with success. But in reality:
- Sales growth tells you whether you’re selling more or less than before,
- Sales profitability tells you whether you’re making money on those sales.
You could be experiencing 125% sales growth but still see your profits shrinking — due to discounts, promotions, rising logistics costs, or increased ad spend. That’s why it’s important to analyze growth alongside metrics like gross margin, EBITDA, or marketing ROI.
From Raw Numbers to Strategic Insight
By placing your sales growth rate in the context of other KPIs, you’re not just measuring change — you’re building a story about how your organization creates value, retains clients, and grows in a meaningful way.
This perspective allows teams to drive sales growth not just in the short term, but with long-term sustainability in mind. For executives, analysts, and sales reps, this type of layered view provides clarity and direction. For leadership, it becomes the foundation of intelligent strategic planning rooted in the reality of your company’s financial health.
How to Use the Sales Growth Rate Indicator in Business Decisions
The sales growth rate isn’t just a number for your reports — it’s a strategic signal that can and should influence your company’s most important decisions. Here’s how you can put it to use:
- Forecasting sales performance – If your average growth rate is 10% per quarter, you can confidently factor that into annual budgets and revenue goals.
- Evaluating marketing effectiveness – If a campaign launch leads to a 25% increase in sales, it’s a strong sign that something worked.
- Optimizing sales teams and channels – Growth rates often vary by region or channel. That’s a cue to examine local performance and adjust resources accordingly.
- Offer segmentation – If one product category shows 40% growth while another stagnates, you can shift budget and focus to the high-performing segment.
Ultimately, analyzing your sales growth helps answer a critical question:
Is our development aligned with user expectations and market trends — or is it time to pivot?
Summary: Why the Sales Growth Rate Matters
Whether you’re a startup or a global enterprise, understanding how your sales evolve over a fixed period is crucial. The sales growth rate serves as a key indicator that cuts across industries and company sizes, giving you a clear picture of performance — especially when compared to the same period in the past.
But the true power of this metric lies in its ability to connect dots. By comparing past performance with current results and integrating it with sales analytics, sales pipeline metrics, and sales velocity, you gain the kind of data-driven insights that lead to smarter decision-making.
Tracking sales over a specified period helps you assess the effectiveness of your marketing efforts, identify shifting market trends, and fine-tune your sales goals and growth targets. More importantly, it empowers your team to pursue sustainable growth, not just temporary spikes.
A rising growth rate often reflects positive growth, improved customer satisfaction, and a stronger market position — but only when interpreted in the right context. Combine it with other KPIs, and it becomes a tool not just to measure, but to generate revenue, forecast demand, and build a strategy for consistent growth.
In short, the sales growth rate isn’t just a number. It’s a decision-making compass — one that should be at the center of every performance review, forecast, and strategic roadmap.
Table of Contents