KPI Reporting. How to Create Reports That Actually Help


Many companies generate reports on a regular basis, yet those reports rarely influence decision-making. Documents become longer, the number of metrics grows month after month, and despite that, executives and managers often struggle to determine which data truly matters.
Well-designed KPI reporting brings structure to information, highlights the right direction for action, and helps organizations respond more quickly to change. In this article, we explain how to create reports that do more than collect numbers—they support management, data analysis, and informed decision-making.
Why KPI Reporting Matters for Business Management
In many organizations, reporting has become a routine. New reports, summaries, and dashboards are created on specific days each month. Data flows into spreadsheets, presentations, and BI systems. The problem begins when those numbers fail to drive any action.
Effective KPI reporting works differently. It organizes information about the business and helps teams focus on what truly impacts organizational performance. In this context, KPIs are no longer just statistics. They become management tools and the foundation for decision-making.
In practice, this means one thing: instead of reviewing dozens of tables, managers can focus on a handful of critical metrics that reveal the health of the business.
When sales decline, a KPI report helps identify where the problem starts. When a company grows faster than expected, reports make it easier to understand which activities contribute most to revenue growth.
That is why KPI reporting is much more than a control mechanism. It is the foundation of informed management, enabling organizations to evaluate process effectiveness, monitor goal achievement, and build a data-driven competitive advantage.
KPI as the Language of Performance Management
In modern organizations, numbers serve as a common language. Well-defined KPIs simplify communication between executives, managers, and operational teams. Instead of relying on opinions, organizations can focus on concrete data. Instead of assumptions, they gain measurable insights.
In practice, the KPIs used within an organization should answer three fundamental questions:
- Is the company achieving its business goals?
- Are employees and teams working effectively?
- Are current activities delivering better results?
The specific set of metrics will vary depending on the industry and the nature of the business. In a SaaS company, key indicators may include customer lifetime value (CLV), the number of active users, and customer acquisition cost (CAC).
In sales organizations, performance metrics such as conversion rate, total sales volume, and average deal closing time often play a central role.
As a result, a KPI report becomes much more than a collection of numbers. It serves as a roadmap that shows how daily work contributes to achieving organizational goals.
It is also important to remember that key performance indicators are not designed solely for executives. They are equally valuable for employees and middle managers. When teams understand which metrics are being monitored and why they matter, it becomes much easier to connect everyday activities with business outcomes.
How Reports Support Business Decision-Making
A well-designed KPI report has one primary purpose: to support decision-making.
In practice, this means that reports should not attempt to include everything. Their role is to highlight the most relevant data—the information that helps decision-makers understand the situation and choose the best course of action.
When sales begin to decline, a report should help identify the root cause:
- Is the conversion rate too low?
- Has customer acquisition cost increased?
- Has customer loyalty weakened?
In marketing, reports help evaluate the effectiveness of activities such as content marketing, advertising campaigns, and product development initiatives.
Effective reporting serves several important functions:
- It enables organizations to track progress toward strategic objectives.
- It helps evaluate the performance of employees and teams.
- It supports data analysis and forecasting future results.
- It provides the foundation for informed decision-making.
Companies that manage their business based on data gain a significant advantage: they respond faster than their competitors.
When reports reveal that a particular element of the strategy is underperforming, leaders can adjust their direction before the issue becomes a serious problem. Instead of reacting after the fact, they can make proactive decisions based on evidence rather than assumptions.
How to Choose KPIs That Actually Matter
The biggest challenge in many organizations is not a lack of data—it is information overload.
CRM systems, marketing platforms, and analytics tools generate vast amounts of data about customers and users. As a result, companies often fall into the trap of measuring everything, which makes it harder to focus on what truly matters. That is why selecting the right KPIs is one of the most important aspects of effective management.
Well-designed performance indicators should meet three key criteria:
- They should be directly linked to business goals.
- They should enable progress tracking.
- They should have a meaningful impact on organizational performance.
In practice, this means limiting the number of metrics being monitored. Most companies only need a handful of key indicators that provide a clear picture of business health across critical areas such as sales, marketing, product development, and customer service.
The purpose of KPIs is not to collect more data. Their purpose is to help leaders focus attention on the metrics that drive results and support better business decisions.
The SMART Framework for Designing KPIs
One of the most widely used methods for creating effective performance metrics is the SMART framework.
According to this approach, every KPI should be:
- S – Specific
- M – Measurable
- A – Achievable
- R – Relevant to the business strategy
- T – Time-bound
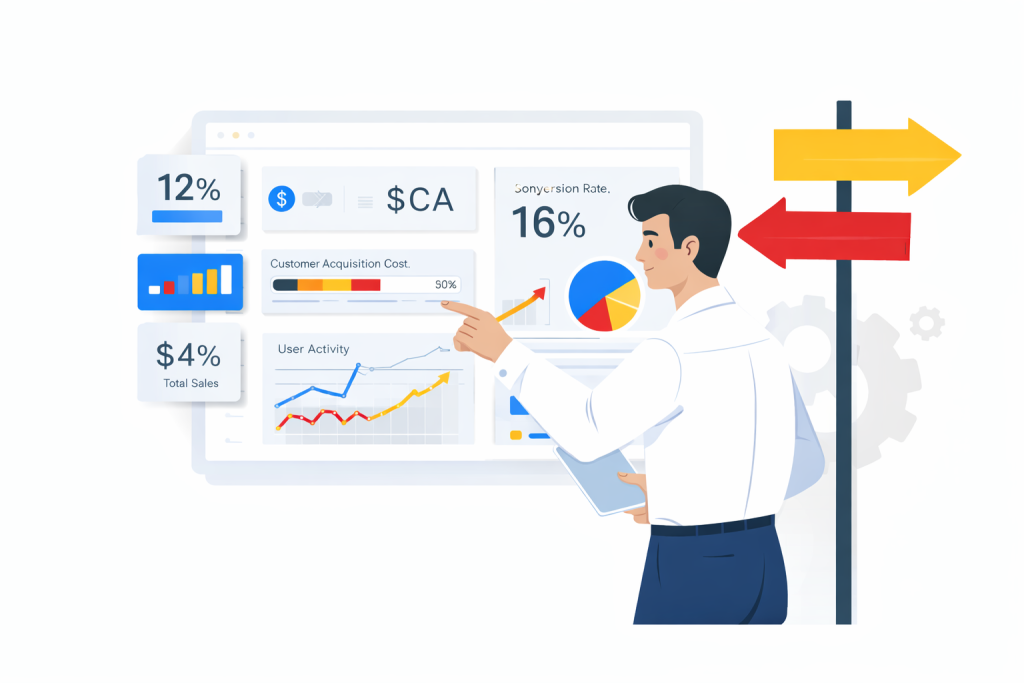
In practice, this means replacing a vague objective such as “increase sales” with a clearly defined KPI, for example:
“Increase the conversion rate from 12% to 16% within six months.”
A KPI defined in this way enables meaningful analysis, objective performance evaluation, and effective management of team activities.
It is also important to remember that the SMART framework is not limited to company-wide goals. It can be applied at the individual role level as well.
For example, a salesperson may be evaluated based on metrics such as the number of new users acquired, total sales value, or the average time required to close a deal.
The more precise the KPI, the easier it becomes to monitor progress, identify performance gaps, and take action before small issues turn into larger problems.
How to Align KPIs with Business Goals and Company Characteristics
There is no universal set of KPIs that works for every business.
The key performance indicators that matter most depend on the company’s business model, market environment, and stage of growth.
For a technology startup, critical metrics may include:
- the number of active users,
- customer lifetime value (CLV),
- product growth rate.
In a manufacturing company, operational efficiency, process effectiveness, and project execution quality are likely to be more important.
In sales organizations, some of the most valuable performance metrics include:
- conversion rate,
- total sales,
- customer acquisition cost (CAC),
- sales cycle length.
That is why the process of selecting KPIs should always begin with a simple question: What are you actually trying to achieve as an organization?
If reports are intended to support management, the metrics they contain must be directly linked to the company’s strategy and business objectives.
Only then does a KPI report become more than a collection of numbers. It becomes a management tool that helps organizations achieve better results, improve operational performance, and build a sustainable competitive advantage.
What Makes a Good KPI Report?
Many organizations produce reports on a regular basis, yet the value of those reports is often limited. Documents contain dozens of tables and countless metrics, but managers still close them after a few minutes because they struggle to identify the information that truly matters.
A good KPI report works differently. It does not attempt to show everything. Instead, it focuses on the factors that have the greatest impact on business performance and goal achievement.
The most important principle is simple: a report should answer a specific management question.
- Is sales performance improving?
- Is marketing attracting valuable users and prospects?
- Are employees and teams operating efficiently?
- Is the company’s strategy delivering better business outcomes?
If a report cannot help answer these questions, it stops being a management tool.
Effective reporting is built on several key principles:
- Reports should focus on a limited number of critical metrics.
- Data should support analysis and decision-making.
- Every KPI report should be directly linked to business objectives.
- Reports should make it easy to track progress against strategic goals.
The best reports concentrate on a small number of key performance indicators that have the greatest impact on the growth and success of the business.

Focus on What Matters Most, Not on More Data
One of the most common reporting mistakes is information overload.
Modern systems generate enormous amounts of data. Marketing platforms, CRM systems, financial tools, and analytics platforms provide hundreds of metrics related to users, sales performance, and customer behavior.
The problem is that most of this information is not necessary for decision-making.
That is why an effective KPI report should focus on the data that matters most. Rather than presenting dozens of metrics, it is far more valuable to select a handful of key indicators that accurately reflect the health of the business.
In sales, these may include:
- conversion rate,
- total sales,
- customer acquisition cost (CAC),
- average sales cycle length.
In marketing, different performance indicators may be more relevant, such as the number of new users, lead quality, or customer lifetime value (CLV).
The key principle is simple: reports should highlight the metrics that have the greatest impact on process effectiveness and overall business performance.
When a report contains too much information, managers begin to lose sight of the signals that truly matter. Instead of supporting management and analysis, KPI reporting can become a source of confusion and distraction.
Jak prezentować wskaźniki efektywności, aby były czytelne
Selecting the right KPIs is only half the challenge. The way those metrics are presented is equally important.
Even the best data will not support decision-making if it is displayed in a confusing or difficult-to-read format.
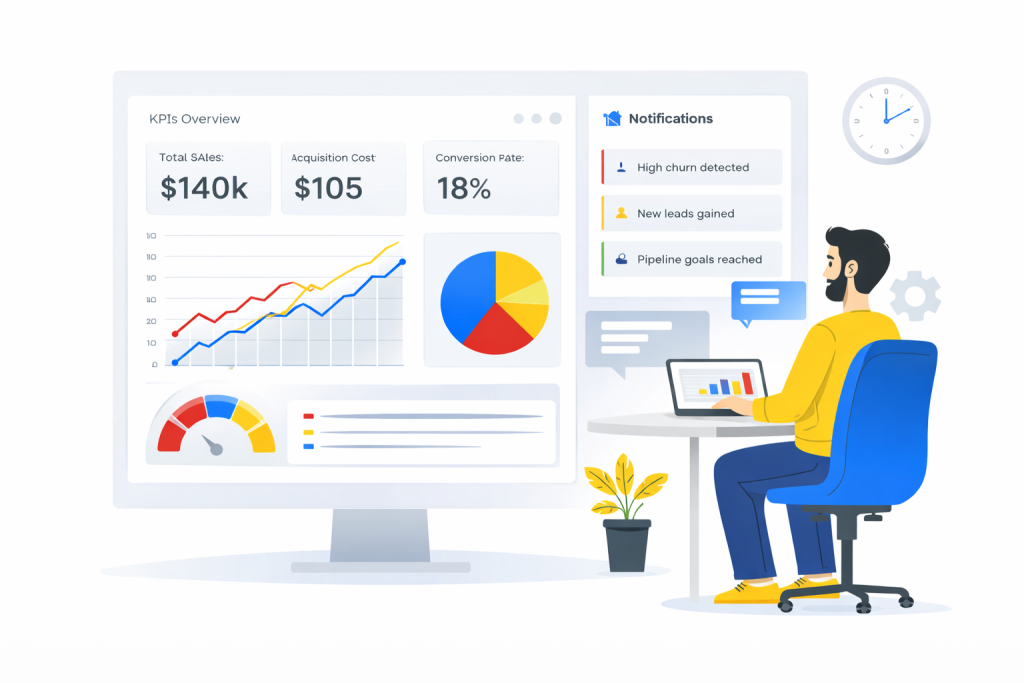
A good KPI report should make it easy to understand the situation at a glance. This means that performance metrics should not be presented solely in tables.
In practice, three formats are particularly effective:
1. Trends Over Time
Charts showing how key metrics change over weeks, months, or quarters make it easy to see whether the business is moving in the right direction.
This allows managers to evaluate performance, identify patterns, and forecast future results more effectively.
2. Performance Against Targets
Every KPI should be measured against a specific business objective.
For example, if the goal is to increase sales by 20%, the report should clearly indicate how close the organization is to achieving that target.
Without a benchmark, even positive results can be difficult to interpret.
3. Business Context
Data always requires interpretation.
That is why a good KPI report should contain more than numbers. It should include concise commentary that explains why specific metrics are increasing or decreasing and what those changes mean for the business.
When presented in this way, reports become much more than collections of data. They evolve into practical management tools that support informed decision-making and help organizations take action with confidence.
How Often Should KPI Reports Be Created and Who Should Use Them?
The frequency of KPI reporting depends on the nature of the business and the specific metrics being monitored.
Some indicators change slowly and only require monthly review. Others—particularly in sales and marketing—should be monitored much more frequently.
Many organizations adopt a multi-level reporting model. This means that different reports are created at regular intervals for different management levels and business purposes.
Such an approach allows companies to analyze performance from both an operational and a strategic perspective.
Operational teams can focus on day-to-day activities and immediate results, while managers and executives can use higher-level reports to evaluate long-term trends, assess progress toward strategic objectives, and identify areas that require attention.
When reporting is structured in this way, it becomes easier to turn data into action rather than simply collecting information.
Operational, Tactical, and Strategic Reports
Most organizations divide reporting into three distinct levels.
Operational Reports
Operational reports are created frequently—sometimes even in real time. Their primary purpose is to monitor day-to-day activities and team performance.
In sales, these reports may track metrics such as:
- the number of sales meetings,
- new leads generated,
- conversion rate.
Operational reports enable managers to respond immediately when performance issues arise, helping teams stay on track and address problems before they escalate.
Tactical Reports
Tactical reports are typically produced weekly or monthly.
Their purpose is to evaluate the effectiveness of marketing, sales, and operational activities. A KPI report at this level may include metrics such as customer acquisition cost (CAC), customer lifetime value (CLV), or user growth trends.
At the tactical level, deeper data analysis becomes particularly important. The goal is not only to understand what happened, but also why it happened and how performance can be improved.
Strategic Reports
Strategic reporting represents the highest level of KPI analysis and focuses on the long-term development of the business.
These reports are usually created quarterly or annually and concentrate on key performance indicators that have the greatest impact on revenue growth, customer loyalty, and competitive advantage.
Strategic reports provide executives with the information they need to make the most important business decisions and evaluate whether the company is progressing toward its long-term objectives.
How Reports Support Employees and Sales Teams
Well-designed KPI reporting should not be viewed as a control mechanism. Its purpose is to help employees and teams achieve better results.
When employees have access to clear and meaningful reports, it becomes easier for them to understand how their actions contribute to organizational goals.
This is especially important for sales teams, which often monitor metrics such as:
- conversion rate,
- number of new users or customers,
- total sales,
- sales cycle length.
Regular analysis of these metrics helps managers evaluate sales performance and identify opportunities to improve the effectiveness of sales processes.
As a result, reports become more than documents created for executives. They evolve into practical management tools that support everyday decision-making, help teams stay focused on priorities, and enable consistent progress toward business goals.
Common Mistakes in KPI Reporting
Well-designed KPI reporting can significantly improve organizational management. It supports data analysis, helps leaders make better decisions, and enables companies to track progress toward their goals.
At the same time, many organizations make mistakes that prevent reports from serving their intended purpose. Instead of helping teams work more effectively, reports can create information overload and consume valuable employee time.
In most cases, these problems are not caused by a lack of technology or data. They result from poor KPI design and an ineffective approach to the reporting process itself.
Too Many Metrics
The most common mistake is trying to measure everything.
CRM systems, marketing platforms, and analytics tools generate enormous amounts of data. As a result, organizations begin tracking dozens—or even hundreds—of metrics.
The problem is that only a small percentage of those metrics are truly relevant to business objectives.
When a KPI report contains too much information, managers lose focus. Instead of concentrating on the indicators that matter most, they spend their time trying to interpret every available data point.
The consequences are predictable:
- meaningful analysis becomes more difficult,
- management effectiveness declines,
- reports stop supporting decision-making.
That is why one of the most important best practices is to limit reporting to the metrics that have the greatest impact on business performance.
This means focusing on a small number of key performance indicators that accurately reflect the health of the organization.
In sales, these may include metrics such as conversion rate, customer acquisition cost (CAC), and total sales.
In marketing, more relevant indicators may include user growth, growth rate trends, and customer lifetime value (CLV).
This approach simplifies KPI reporting and keeps attention focused on the metrics that truly measure business performance rather than creating unnecessary complexity.

Reports Created for the Sake of Reporting
Another common mistake is creating reports that never lead to action.
In many organizations, reporting has become an administrative exercise. Data is collected at regular intervals, reports are distributed to managers, and then… nobody looks at them again.
When this happens, a KPI report loses its primary purpose.
The goal of reporting is not to document the past. Its purpose is to support management and enable informed decision-making.
That is why every KPI report should answer a specific business question, such as:
- Are marketing activities increasing the number of users or qualified leads?
- Are sales teams achieving their target conversion rates?
- Is the company’s strategy contributing to revenue growth?
If a report does not lead to business decisions, its value is limited.
High-performing organizations treat reports as an integral part of the management process. Reporting is directly connected to planning, performance reviews, and decision-making.
Every analysis should end with actionable conclusions that help improve performance, increase process effectiveness, and move the organization closer to its strategic objectives.
The most valuable reports are not the ones that contain the most data. They are the ones that inspire action.
Conclusion: How to Create KPI Reports That Actually Support Management
Effective KPI reporting is not about collecting as much data as possible. Its purpose is to create an information system that supports organizational management and enables better decision-making.
A well-designed KPI report should:
- focus on a small number of critical metrics,
- make it easy to track progress toward strategic goals,
- support data analysis and forecasting,
- help managers and employees make informed decisions.
KPI reporting delivers the greatest value when it is directly connected to business objectives and clearly demonstrates how activities influence business outcomes.
This requires moving away from random metrics and focusing instead on key performance indicators that have the greatest impact on organizational growth.
When the right KPIs are in place, managers can evaluate performance more effectively, monitor progress toward goals, and identify areas that require improvement. At the same time, teams—including sales teams—gain a clearer understanding of how their daily work contributes to overall business success.
That is why well-designed reporting remains one of the most important tools in modern management. It helps organizations respond faster, make better decisions, and build a sustainable competitive advantage across industries.
Table of Contents