
Sales Reporting in a Company: How to Make It More Efficient


Effective sales reporting is the foundation of sales management—yet in many organizations it is still a time-consuming, fragmented process full of errors. In this article, we explain how to create sales reports and broader sales reports that genuinely support informed decisions by sales managers, instead of merely archiving data. Well-prepared reports make it possible to understand the company’s sales performance, assess where opportunities currently sit within the sales funnel, build a reliable sales forecast, and plan sales strategies more effectively.
More and more companies are basing their sales reporting on automatically updated sales data, collected from every customer interaction, every meeting, and all sales activities performed by sales teams. This approach removes manual data entry, saves time, and delivers valuable insights that support revenue growth and long-term business goals.
What Is Sales Reporting—and Why Do Companies Still Struggle With It?
In theory, sales reporting should provide a clear answer to a simple question: does the sales process work the way it should? In practice, many organizations are still stuck with manual spreadsheets, where each sales representative tracks data differently and sales managers try to piece together a coherent picture. The result is inconsistency, gaps in relevant data, and a high risk of misinterpretation.
The most common challenges include:
- the need to manually combine raw data from multiple sources—customer relationship management systems, notes, emails, and files,
- incomplete or inconsistent data collection,
- difficulty assessing how many real opportunities exist in the sales pipeline,
- limited visibility into where deals drop off at each stage of the sales cycle,
- insufficient insight into sales cycle length, sales volume, or pipeline value,
- a lack of structure that allows teams to quickly understand closed deals, total revenue, and sales figures for a given period.
Without this clarity, it is impossible to understand which parts of the entire sales process are working and which require improvement. That is why most sales teams are investing in sales reporting software and sales reporting tools that automate reporting sales activities, eliminate manual work, and transform sales reports into a clear narrative about customer behavior—making it easier to identify trends, bottlenecks, and opportunities to improve sales performance.

Sales Reports and a Real Understanding of Sales Results
Many organizations generate sales reports, but only a few truly know how to use them. A simple list of numbers rarely delivers value. Real insight emerges only when sales reports are connected to the context of the sales process and the broader sales cycle.
Examples that make a real difference include:
- analyzing which sales activities actually drive conversions,
- identifying which product or service categories generate the highest sales revenue and profitability,
- monitoring conversion rates that fall below expectations,
- evaluating whether current key performance indicators and key performance indicators KPIs align with business growth,
- tracking which opportunities stall at specific stages of the sales pipeline and why they fail to progress.
At this stage, advanced sales reporting software enables deeper sales analysis, supports creating sales reports tailored to different needs, and helps present sales data in a way that drives action—such as a clear chart showing funnel conversion or how many new opportunities entered the pipeline during a given period.
As a result, sales managers can not only prepare more accurate sales forecasts, but also actively support sales reps by pinpointing where challenges arise and what needs to change to improve sales performance and increase future revenue.
Which Sales Reports Really Matter? (Practical Examples)
Not every sales report supports effective sales management. Companies often generate dozens of sales reports, most of which add little value beyond “looking good.” Meanwhile, sales managers only need a few key views that allow them to quickly assess the sales process, sales performance, and the quality of sales efforts executed by sales reps.
The most useful types of sales reports include:
1. Sales Activity Performance Report
This report shows which sales activities actually lead to conversions and which are merely activity for activity’s sake.
In practice, many organizations discover that a large portion of their sales efforts has no real impact on sales volume, sales revenue, or average deal size.
Example:
A B2B company discovered that cold calling delivered surprisingly strong conversion rates—but only when the sales representative sent a follow-up within 48 hours. No follow-up meant no close deals.
2. Sales Funnel Structure Report
A critical report that shows at which stages—and at what scale—opportunities drop out of the sales funnel.
This type of sales report presents:
- how many potential opportunities enter the funnel,
- how many move to the next stage,
- conversion rates at each stage,
- where bottlenecks appear.
Sales managers can immediately see where to strengthen sales strategies and where the sales process has become overly complex.
3. Product Category Profitability Report
Many companies rarely analyze which product category truly drives sales revenue.
Yet for planning effective sales strategies, this insight is essential.
Real-life example:
In a SaaS company, customers purchased three modules, but only one generated the highest profitability. After reviewing this sales performance report, the company adjusted its sales process—and revenue growth reached 21% quarter over quarter.
4. Sales Cycle Length Report
This report shows how much time passes from first contact to contract signing. It helps organizations understand:
- which customer segments move quickly,
- where the sales cycle slows down,
- how this affects the sales forecast and future revenue.
This insight enables realistic planning of hiring, budgets, and the sales pipeline.

Custom Sales Reports That Support Business Decisions
While standard sales reports explain what happened, custom reports answer why it happened. This is the difference between static reporting and tools that actively support informed decisions.
Examples of custom sales reports that genuinely change how sales teams operate include:
1. Sales Rep Performance by Product and Stage
This report combines:
- funnel stage data,
- product category information,
- sales rep performance,
- effectiveness of specific sales activities.
It helps answer questions such as:
- Which sales reps excel during discovery calls and which perform better at the proposal stage?
- Which products require different sales tactics or messaging?
- Where should coaching be introduced?
2. Pipeline Value Report Including Potential Deals
This report shows:
- total pipeline value,
- number of potential deals,
- probability of moving to the next stage,
- expected revenue in a given period.
Its practical value is clear: sales managers know whether sales targets are achievable—and can act before issues impact results.
3. Sales Data Quality Report
Before advanced sales analysis is possible, companies must ensure they are working with reliable sales data.
A data quality report verifies:
- whether sales reps complete required fields,
- whether each record has an up to date status,
- whether key fields needed for sales forecasting are filled in.
Without this, it is impossible to create even a basic sales forecast.
4. Predictive Sales Report
A company does not need data scientists to predict future revenue.
A predictive sales report can analyze:
- historical sales data,
- customer behavior,
- effectiveness of sales efforts at each stage of the sales cycle,
- deal value and close rates.
This type of sales report communicates clear scenarios:
“If nothing changes, this quarter will close at X.”
“If activity increases in this area, revenue rises by Y.”
These insights turn sales reporting from simple documentation into a tool that actively supports sales leaders, improves sales performance, and strengthens the entire sales process.
Sales Analysis Based on Sales Data
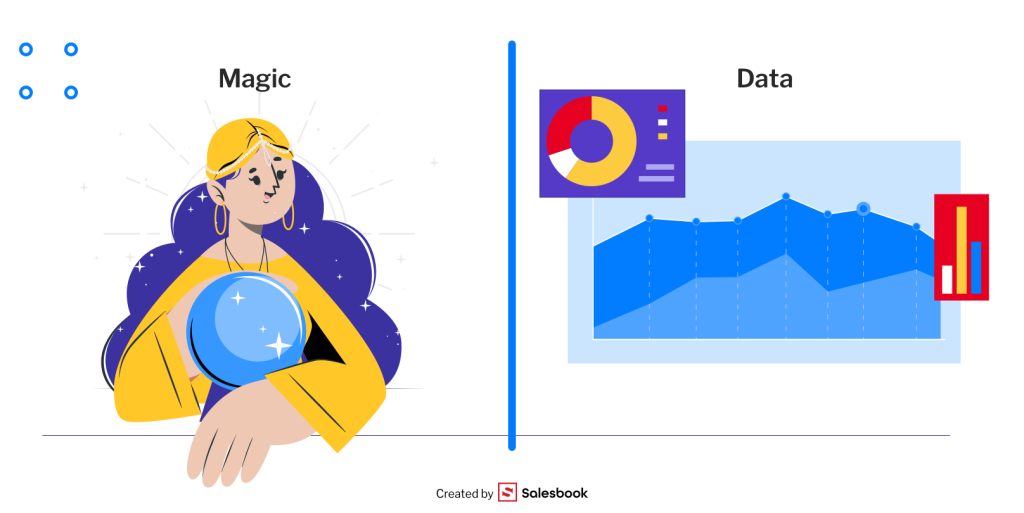
Strong sales analysis is not driven by intuition, but by hard data—automatically updated based on sales data and the daily activity of sales teams.
These analyses make it possible to:
- build realistic sales forecasts,
- plan the sales pipeline for upcoming months,
- identify where sales reps should increase activity,
- determine which product category has the greatest potential,
- understand which sales activities have the strongest impact on sales performance.
In well-run organizations, analytics is not an add-on—it is a background process that supports the entire sales process, from first contact with prospects to closed deals.
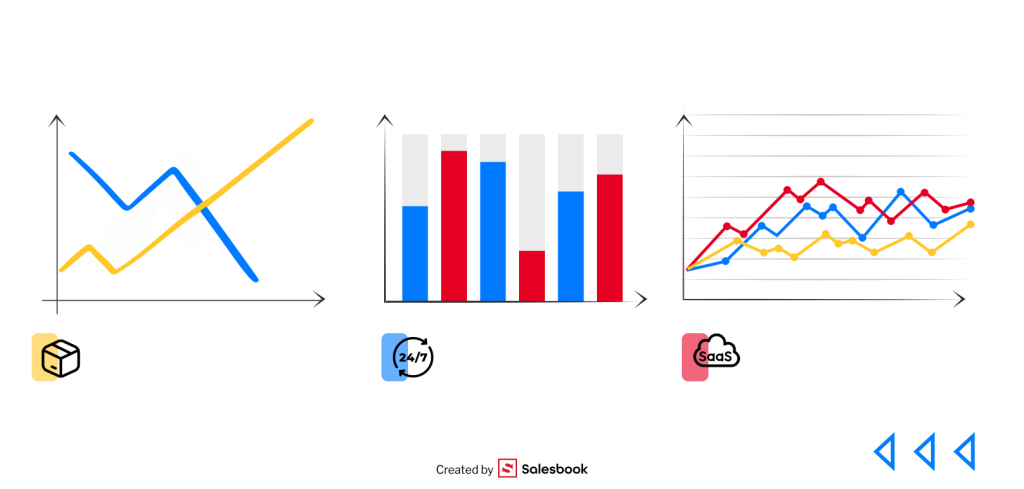
The most effective companies translate raw data into clear visualizations, such as bar charts showing performance at each stage of the sales cycle or conversion reports by sales representative. These are not “nice charts,” but practical tools that support informed decisions based solely on facts.
How to Improve Sales Reporting Through Better Organization of Sales Activities
If a company wants to improve reporting sales, it must start by organizing how data is collected. Most reporting errors are not caused by tools, but by inconsistent ways of working across sales teams—no standards, different formats, varying interpretations of CRM fields, and missing information.
Key organizational elements include:
- clear rules for logging sales activities so each task has proper context,
- precise guidelines for entering data related to prospects,
- ongoing data quality control to ensure opportunity status is always up to date data,
- eliminating duplicate work by replacing spreadsheets and manual data entry with automation,
- clear ownership within the sales team so everyone knows which data to update at each stage.
A well-structured process also allows teams to quickly spot where problems arise and which elements block opportunities from moving forward. Without this foundation, even the best sales reporting software will not deliver a good sales report.
What Data Should You Collect to Create Fewer—but Better—Sales Reports?
One of the biggest paradoxes in sales management is that the more data companies try to collect, the less value they extract from it. Effective sales reports do not require hundreds of fields—they require the right data.
Organizations should collect:
- data on opportunity stages,
- lead qualification status,
- product category associated with each deal,
- expected deal value and total revenue potential,
- qualitative notes that support deeper sales analysis,
- win/loss reasons for closed deals,
- sales rep activity data to analyze real impact on sales results.
This approach makes reporting sales activities simpler, faster, and far more valuable. Fewer fields mean fewer errors, fewer inconsistencies, and more time focused on closing high-value opportunities rather than administration.
Sales Forecasting – How to Predict the Future Accurately
Accurate sales forecasting is not based on gut feeling or weekly optimism from sales reps.
It relies on:
- analyzing historical sales data and trends and patterns,
- evaluating pipeline quality for the current period,
- understanding movement speed through the sales funnel,
- tracking conversion rates,
- assessing the quality of offers,
- realistically estimating how many opportunities can advance to final stages.
Sales managers who want reliable forecasts should use:
- pipeline value reports,
- data on new customer acquisition,
- close-rate trends by segment,
- past sales data for specific product categories,
- analysis of how many deals can realistically close in the next quarter.
A strong forecast clearly states:
“At this activity level and with this pipeline quality, total revenue will reach X”—instead of relying on hopeful assumptions.
How Sales Activity Data Impacts Sales Forecasts
Without accurate data from daily sales activities, no forecast is reliable. Calls, follow-ups, meetings, demos, and proposal work directly shape future revenue and the company’s sales performance.
Sales activity data matters because it:
- shows the real pace of opportunity movement through the sales process,
- highlights bottlenecks,
- reveals which segments respond faster,
- identifies where the sales cycle slows down,
- indicates how many opportunities in the pipeline are truly viable,
- tracks changes in average deal value,
- enables forecasting based on facts, not assumptions.
Example: if a sales representative reduces follow-ups by 50% and conversion rates drop, the system automatically lowers the sales forecast. If new leads enter the pipeline faster, future revenue projections increase.
That is why high-performing organizations analyze sales data daily—not monthly—and rely on systems that translate activity into numbers that reflect reality.
Why Effective Sales Reporting Is Impossible Today Without Automation and AI
Modern sales generates enormous volumes of data. Manual reporting no longer works. Sales reps complete dozens of actions daily, pipelines change hourly, and decisions must be made faster than ever.
Companies that still rely on spreadsheets operate with outdated and inconsistent data, making it impossible to accurately assess the company’s sales performance or build a reliable sales forecast.
Automation solves this by:
- capturing sales activities in real time,
- eliminating manual data entry,
- reducing errors,
- providing full visibility into the entire sales process,
- enabling quick identification of bottlenecks,
- generating instant analysis based on historical and real-time data.
AI goes a step further—it does not just explain what happened, but predicts what will happen next. Without automation and AI, modern sales reporting simply does not work.

AI in Sales Performance Analysis – What Works and What Is Just Marketing
AI is widely discussed in sales—but only solutions grounded in real sales data deliver value.
What works:
- Predictive forecasting based on real data
AI analyzes sales activities, stage progression, and customer behavior to generate realistic forecasts. - Anomaly detection
AI can identify issues managers might miss, such as sudden drops in conversion rates or unusual increases in deal value. - Pipeline quality assessment
AI evaluates which opportunities have real potential and which only inflate the pipeline. - Action recommendations
If follow-ups decline, AI can flag the issue and suggest corrective actions.
What is just marketing:
- “AI that sells for you” — does not exist.
- “Algorithms that know better than data” — impossible.
- “AI that magically boosts conversions” — conversions improve through disciplined sales efforts and strong processes.
AI delivers value only when built on accurate sales reports, consistent data collection, and a clearly defined sales process.

How Salesbook Improves Sales Reporting process
Salesbook is not another tool that generates endless reports. Its purpose is simple: help companies understand sales clearly, accurately, and without manual work.
1. Automatic data capture from sales activities
Every meeting, presentation, and interaction is recorded automatically, making sales reporting work a natural part of daily operations.
2. Fact-based reporting
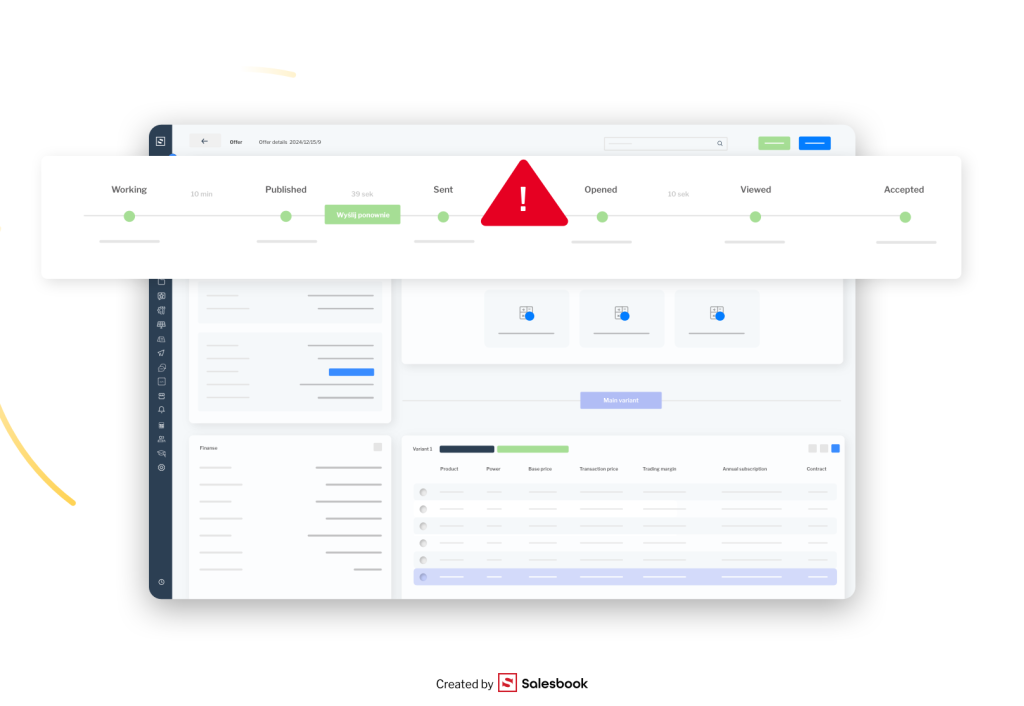
Data flows into the system in real time, giving sales managers visibility into pipeline status, stage progress, opportunity quality, deal count, and movement between stages.
3. Clear visual sales analysis
Instead of tables, managers see charts showing performance by segment, sales reps, product categories, and conversion rates.
4. Custom sales reports tailored to the business
Teams can create custom reports focused on efficiency, pipeline quality, closed deals, and product segmentation—without relying on rigid templates.
5. AI-driven revenue prediction
The system analyzes prospects, activity history, and conversions to generate realistic forecasts aligned with the current pipeline.
Salesbook replaces intuition with facts and turns sales reporting into a decision-making engine.
Summary – How to Implement Effective Sales Reporting in Your Company
Effective sales reporting is not about producing more reports, but about collecting the right data, organizing processes, and automating manual work.
To improve sales reporting:
- standardize how sales teams work,
- automate data collection,
- focus on a few good sales reports instead of many unused ones,
- analyze data in real time,
- apply AI where it creates real value,
- protect data quality,
- connect analysis directly to action.
Organizations that follow this model make faster, smarter decisions and gain a level of clarity that is difficult to match in today’s competitive environment.
FAQ – Short Answers to Common Questions
1. Which sales metrics should be monitored on a daily and monthly basis?
On a daily basis, sales teams should monitor metrics that allow them to monitor progress across the entire sales process: pipeline value, conversion rates at each stage, number of active opportunities, and the volume of key sales activities. These indicators help track both individual and team performance in real time.
A monthly sales report should go a step further. It should summarize sales figures, sales trends, changes in the sales funnel, and the overall sales team’s performance against targets. This is also the moment to analyze team performance metrics, evaluate how the company’s sales activities influence results, and compare outcomes against historical benchmarks and market trends.
2. How can sales reporting help improve sales strategies?
One of the key benefits of sales reporting is the ability to turn raw numbers into actionable insights. Regular data analysis allows sales leaders to identify patterns, spot inefficiencies, and adjust sales strategies before problems escalate.
By reviewing sales trends, conversion data, and customer behavior over time, companies can improve sales strategies based on facts rather than assumptions. Well-structured reports show what works, what does not, and which actions should be reinforced or eliminated—especially when aligned with the target audience and real buying behavior.
3. How do I create a sales report that is actually useful?
To create a sales report that delivers value, start by defining its purpose. A good sales report should answer a specific business question, not try to cover everything at once. Decide who the target audience is—sales managers, sales reps, or executives—and adjust the level of detail accordingly.
Effective reports rely on consistent data collection, clear definitions of metrics, and structured data analysis. Using proven sales report templates can help standardize reporting and reduce errors, while sales dashboards make it easier to present sales data in a clear, visual way that supports faster decisions.
4. What types of sales reports should every company use?
Most organizations benefit from a small set of core reports rather than dozens of unused ones. These typically include:
- a sales activity report showing how daily actions translate into results,
- pipeline and conversion reports to assess deal flow,
- performance reports tracking sales rep and sales team outcomes,
- trend reports highlighting changes in sales trends and market behavior.
Together, these reports form the foundation of what sales reporting plays should support: visibility, accountability, and continuous improvement.
5. How does sales reporting support team performance and accountability?
Sales reporting makes individual and team performance visible and measurable. When sales teams clearly see how their actions impact results, accountability improves naturally. Reports focused on sales team’s performance help managers identify coaching needs, recognize top performers, and balance workloads more effectively.
Tracking team performance metrics over time also reveals whether improvements are sustainable or temporary, supporting better planning and more realistic goal setting.
6. Can sales reporting support areas beyond sales, such as operations or inventory?
Yes. Modern sales reporting often connects sales data with other business areas. For example, insights from sales reports can support inventory management by showing which products sell faster, which deals are likely to close, and how demand may change.
Analyzing customer lifetime value also helps companies better understand long-term profitability, align pricing strategies, and prioritize customers who generate sustainable revenue rather than short-term wins.
7. What are the most important sales reporting tips for growing teams?
For growing organizations, a few practical sales reporting tips make a major difference:
- focus on fewer, higher-quality reports,
- ensure data is up to date and consistent,
- automate data collection wherever possible,
- use dashboards instead of static spreadsheets,
- review reports regularly and link them directly to decisions.
When reporting is treated as a decision-support tool—not an administrative task—it becomes a powerful driver of growth, clarity, and long-term performance.
Table of Contents