4 May 2023
Sales analysis allows you to perceive the entire sales process from a distance. However, are key performance indicators enough to see the full perspective of the work of a sales team? What else can you add to your sales reports to make your analysis effective? How to increase average revenue based on sales data?
What is sales analysis?
Sales analysis is a process that relies on gathering, analyzing, and interpreting data on selling products or services. During analysis, you should include different factors that cause an increase or a decrease in sales. Therefore, reading reports can be very helpful.
Data included in reports come from various areas. They show, for example, the average sales cycle length, sales performance in relation to the given time, customer acquisition costs, customer lifetime value (CLV), number of complaints, number of new customers, and many more.
As David Sides said,
“Data is like dim light when you get lost in a dark room. Follow it, try to understand it, and maybe you will actually know where you are and what is around you.”
What are Key Performance Indicators (KPIs)?
Key Performance Indicators (KPIs) are used by sales managers and high-performing sales teams to maximize profits, be successful, beat their competitors, and boost sales revenue.
It is important to track sales KPIs because they show a given company’s development and the progress of its employees. KPIs measure sales efforts, we can say that they change hard data into sales metrics that help you to check if your business is able to achieve essential goals.
Every company that has its sales strategy uses sales performance metrics to know which elements in the sales process need improvement and which are profitable.
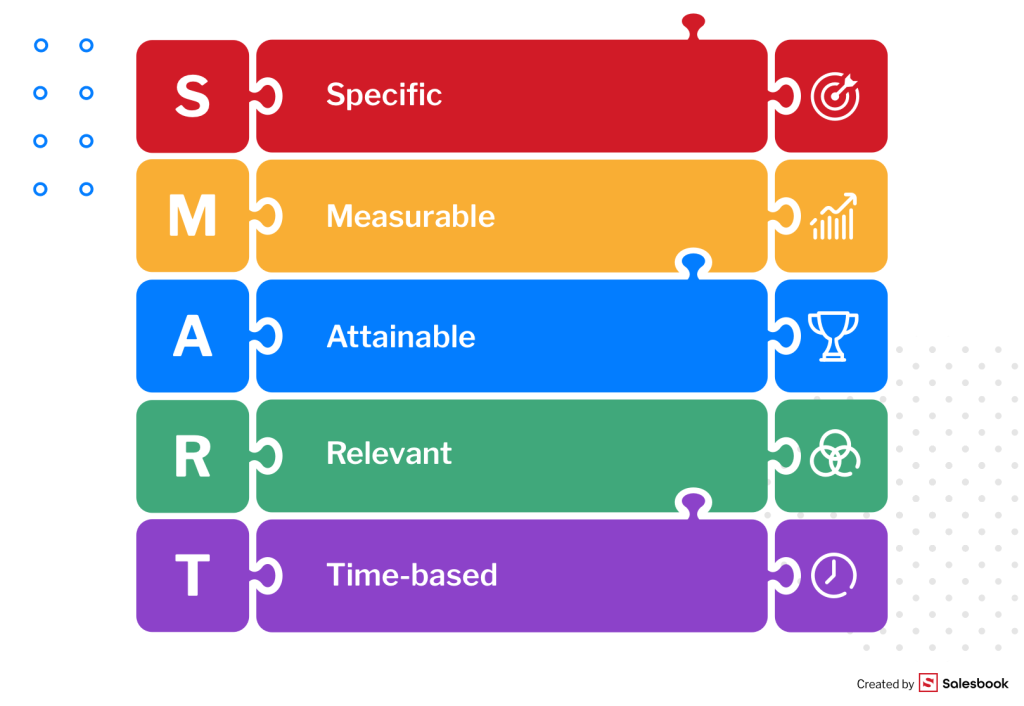
The definition of sales KPIs says that they should be SMART: specific, measurable, attainable, relevant, and time-based.
However, there are no universal KPIs for every business. Metrics depend on the type of company and industry.
For example, in e-commerce, it is important to track the average purchase value, the number of complaints in an e-shop, or the conversion rate. Marketing teams will track the average customer acquisition cost, lead conversion rate, and customer lifetime value (CLV). The last metric shows the entire revenue your business can expect from a customer.
What can your sales team analyze?
Obviously, your sales team has to analyze KPIs. It depends on your company and your decision on which sales KPIs will be important for your sales reps. What are the best KPIs for sales?
1. Trends sales analysis
You need to consider even historical sales data to know what affected sales growth; thanks to that, you can perceive repetitive patterns; you can find such sales data inside your company in sales reports.
2. Sales analysis of costs
Sales metrics needed in this analysis are related to the costs of sales (marketing, production, research of customer satisfaction, market analysis).
3. Profitability of sales
This analysis contains information about the number and value of sales transactions and gross profit.

4. Products or services sales analysis
This analysis shows which products or services are the most popular among existing customers and new clients, this can also show which customer segments are profitable and how much revenue they bring to the company, thanks to this analysis, a given sales rep knows which goods and customers are worth focusing on.
5. Customer retention
This analysis shows which customers continue to buy your products or services and why.
6. Customer acquisition cost (CAC)
Sales KPI included in this analysis tracks the costs of acquiring new customers (both in sales and marketing), if you understand the results of this analysis you will be aware of which resources of leads increase your profit (cost per lead).
7. Engagement of sales reps
You can track and analyze the work of the entire sales team or a chosen sales rep. Moreover, you can compare an individual rep performance metrics with a contact method, and the number of follow-up e-mails or meetings. Thanks to this, you can have a bigger picture of the work of your sales department.

8. Sales funnel analysis
If you analyze a sales funnel you know which behaviors of your customers are repetitive, and what kind of sales activities are effective, this knowledge allows you to improve some elements of a sales pipeline to sell more.
9. Sales methods analysis
Thanks to this analysis, you know which sales reps are the most effective and what kind of method they use to be persuasive in a sales process.
10. Sales forecast analysis
It is an analysis of a strategy from a short and long-time perspective, you need it to plan your budget, for example, each customer may have an estimated purchase value.
These are examples of analyses that you can do in your company. Each analysis will require a different sales KPI to be completed. Of course, you add more metrics important to track, such as monthly recurring revenue, monthly sales growth, cost per lead, and the number of qualified leads.
However, there are opinions that companies do not need a lot of KPIs. They just need the right sales KPIs.
Regardless of the analysis and sales KPIs you choose, you need hard data to have a realistic picture of how your company works. Lack of reliable data leads to combining analysis with hypothesis. Meanwhile, the success and effectiveness of sales leaders who work for you, depend on how you interpret data. Interpreting data affects redefining sales KPIs, sales strategies, or even methods applied by sales reps.
The tip of the iceberg rule: do not underestimate sales analysis
There are numerous arguments to support the thesis that every company should not neglect sales analysis and reliable data.
An iceberg is the best metaphor that represents the results of gathering incomplete data on sales activities. What is the hidden meaning? If you see an iceberg in the sea, you usually perceive only its tip. However, you do not know what is under the surface of the water. A large part of the iceberg can be hidden.

The tip of the iceberg theory is widely known in psychology because of Sigmund Freud. He was of the opinion that the tip is our conscious knowledge, and the unaware part is under the water.
This theory can be related to the sales process. Sales KPIs and average purchase value show that everything is ok. You lower your guard because you do not see any potential threats to your company.
However, the reality can be different from expectations. Probably, you do not see any occurring problems that may affect your team’s performance or even the financial results of the entire company. Therefore, you need professional sales analysis.
How does sales analysis affect sales performance and your company?
What about tracking sales KPIs in your company? Do you use sales dashboards that display them in your CRM system (Customer Relationship Management)? Do you know if every sales KPI in your organization is attainable? There are more questions that you should ask yourself. What do you know about your clients and their needs?
Precise sales analysis provides you with many answers to your questions.
What can you gain if you do sales analysis?
- You make decisions on the basis of hard data and can change your sales strategies or business model if it is necessary.
- You collect various data in different reports, for example, the number of sales qualified leads, customer lifetime value, monthly recurring revenue, cost per lead, your team’s performance, and many more. For example, if you know your average sales cycle length, and the model of a sales pipeline, you can predict the number of closed deals.
- If you use modern tools, you can automatically generate reports and analyze them in relation to sales trends and strategies. You monitor results and check how far they are from your assumptions and goals.
- Your marketing and sales teams know the results of their cooperation because of data on marketing campaigns and new leads.
- You define sales KPIs that are achievable and motivate your sales reps and sales managers. Therefore, it is easier for them to reach sales targets.

- Thanks to relevant data on sales KPIs, you know which sales rep or sales manager is engaged in work. Their commitment is reflected not only in high sales metrics but also in average revenue.
- Mistakes in customer service are clearly visible and you can react quickly. You improve the quality of service to affect customer retention.
- You know your customers better – their plans, needs, and everyday obstacles.
Sales analysis. How to start?
As we have mentioned, sales analysis is essential to your company. However, a lot depends on gathering both qualitative and quantitative data on the sales process in your company.
If you use the right tool, you can analyze the entire sales cycle – from a meeting with a client to the closed deal and its sales value.
Salesbook is a tool that every sales manager can use to analyze sales. Moreover, it supports the everyday work of sales and marketing teams. It is a complete sales platform and analytical tool. It gathers data when a sales rep is in a meeting with a customer. Data are automatically sent to a system that can generate reports on crucial areas of sales.

Thanks to this, a sales rep does not have to make notes or fill in Excel tables in a hurry.
Complete sales analysis of the sales process with Salesbook
We can say that a typical sales cycle consists of the following elements:
- PRESENTATION,
- CUSTOMER NEEDS ANALYSIS,
- OFFER,
- CONTRACT,
In Salesbook, we have improved this process and created the SALESBOOK FORMULA by adding:
- AUTOMATION,
- CRM,
- ANALYTICS & AI.
These elements allow you to do reliable sales analysis. You will read more about it in the next paragraph.
What can you analyze with Salesbook?
As we have mentioned, Salesboook allows you to analyze the sales cycle step by step. It is possible thanks to automation and collecting data during a meeting. Therefore, sales reps are bound to have all relevant data.
Meetings with customers
Take a closer look at a usual meeting with a customer that starts with the presentation of the offer.
“Great salespeople are relationship builders who provide value and help their customers win” – said Jeffrey Gitomer, one of the American business coaches.
Thanks to Salesbook, you gain knowledge not only about the number or places of meetings but also about sales reps’ methods that are the most effective.
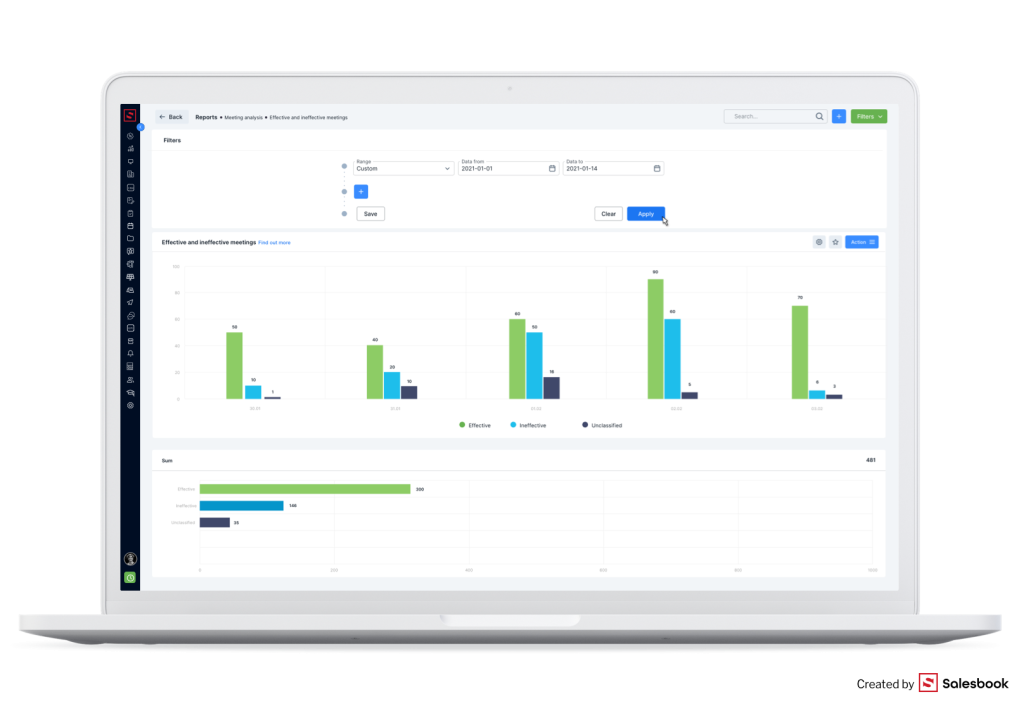
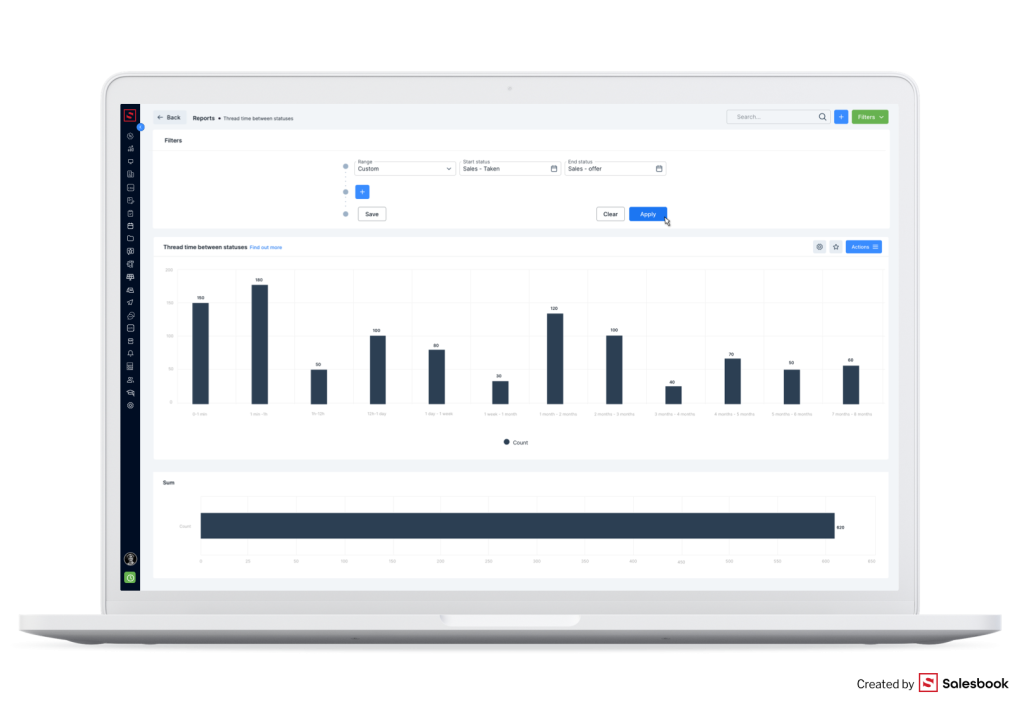
What can you know from reports on sales meetings?
- How often do sales reps arrange meetings, and where?
- What are the statuses of meetings? How do they change?
- What is the number of effective and ineffective meetings?
- What is the average length of meetings? Do salespeople spend their time discussing important issues?
- How many meetings have been interrupted and why?
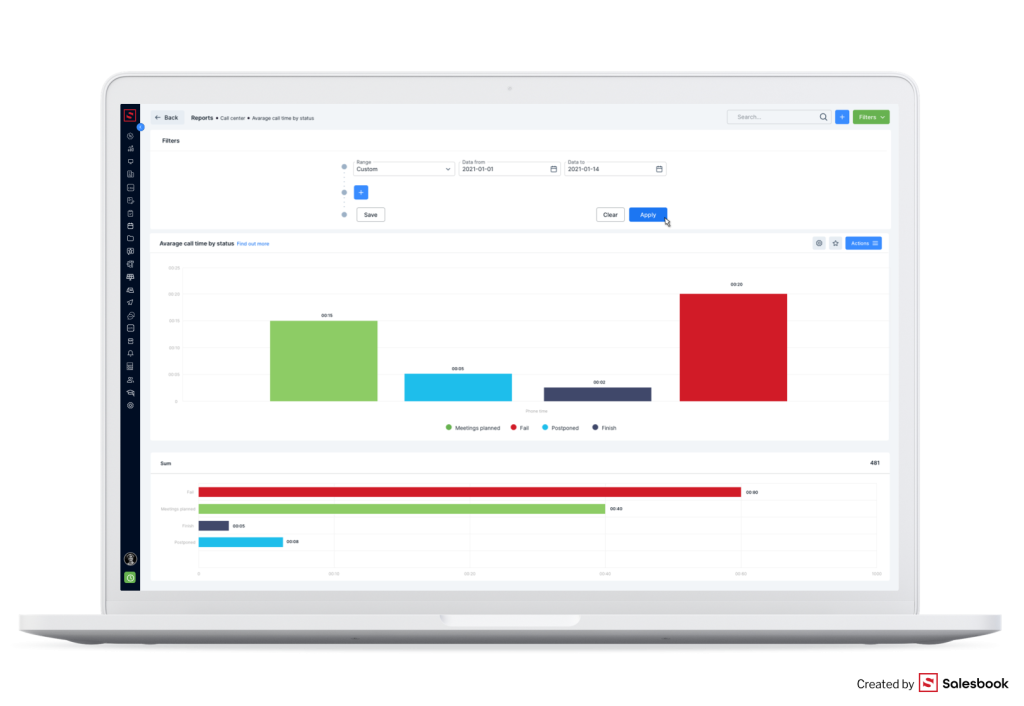
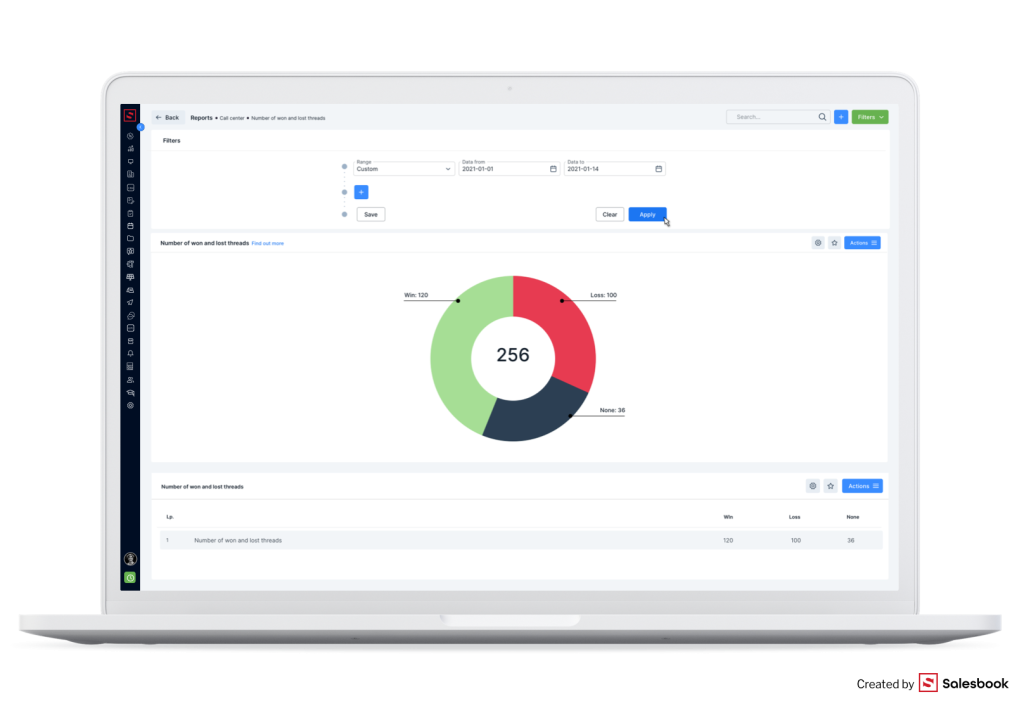
Phone calls with the Call Center module
If you run your business in the Call Center industry, you can plan and implement a campaign with Salesbook. After its implementation, you can also analyze its results.
What can you analyze?
- the number of calls and calls to make,
- which salespeople have made the most phone calls, and which – the fewest,
- how many meetings were carried out and how many were rescheduled,
- if salespeople use scripts,
- how many phone calls are needed to reach a client.
Effective elements in the sales process
We have mentioned that sales meetings consist of the offer presentation and customer needs analysis. If a salesperson uses Salesbook, all data are automatically sent to the system. As a result, you can analyze every meeting step by step, and optimize it.
You can find out about:
- the best practices of the most effective salespeople,
- their average time between contacts in a sales pipeline,
- the frequency of their phone calls,
- the time devoted to a given client,
- marketing materials used during a meeting.
How good is your offer?
Sales are about being outstanding and giving your customers the best offer. If you analyze your sales with Salesbook, you know which elements are the most effective.
What can you know about sales of your products?
- Which products record an increase in sales?
- Are there any products that record an increase in sales in given seasons?
- Do salespeople devote more time to selling some products than others?
- In what way do discounts affect sales?
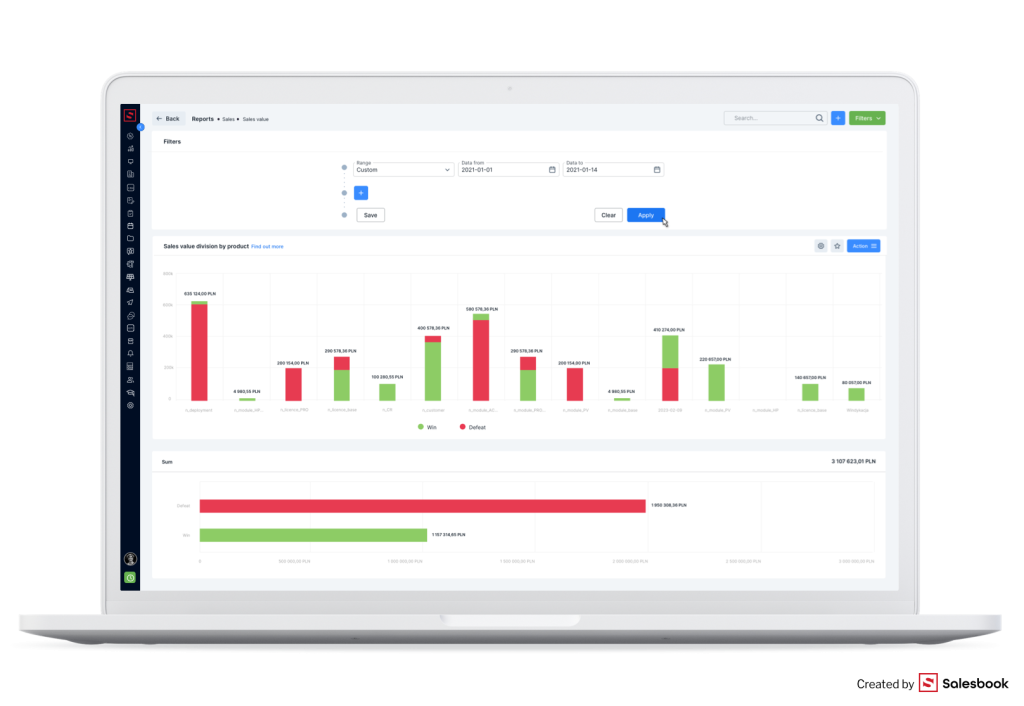
Sales value
A sales value is another factor that you need to take into account during doing analysis.
If you use Salesbook, you can analyze your sales growth and:
- sales value in a given time,
- sales value in relation to products,
- sales value in relation to salespeople,
- value of won and lost sales opportunities.
Sales KPIs and their reliability
As we have mentioned, KPIs for sales departments are necessary because they help measure the effectiveness of particular activities, and they are used to analyze sales. In Salesbook we have created the KPI module that allows you to define them precisely. Thanks to it, you have the exact data about every sales KPI you set.
What can you know about sales KPIs?
- What KPIs are set by the company? Are they attainable?
- To what extent have specific salespeople achieved their planned KPIs? What are their sales opportunities?
- How many people have achieved KPIs? What is their level?
- What kind of sales activities are related to sales KPIs?
Sales forecast
Thanks to sales forecast analysis, you will know the relationship between present sales value and your future goals.
What will you know using Salesbook?
- The sales value of sales opportunities that are about to be won.
- The sales forecast of products.
- Which salespeople sell products in relation to the sales forecast.
Signing contracts
Signing a contract is another element important to track and analyze. Thanks to analysis, you can monitor how many new contracts your company has gained or lost.

What can you analyze?
- Frequency of signing contracts by a given salesperson.
- The time between the first contact and signing a contract (sales cycle length).
- Type of customers who sign contracts more than others.
- Frequency of meetings, follow-up e-mails, and phone calls.
Summary
Salesbook is an effective tool for analyzing sales that has been chosen by many companies. Thanks to automation, you can be certain that you will have complete sales data and not omit any information.
Check what Salesbook can do for you
Try our free demo to check Salesbook’s opportunities.


Test Salesbook for Free
Any questions? Feel free to contact us.
+44 203 807 0179help@salesbook.com sales@salesbook.com
Our Customer Success Team is available from Mon. to Fri. 9am - 5pm CET.
We support inquiries, processes of configuration and use of Salesbook app, as well as billing and technical issues.