
4 May 2023
A sales process is something that you have to analyze even to know when your sales performance is gradually lowering. Key performance indicators (KPIs) are sales metrics that help you track progress and check the effectiveness of sales of products or services. However, how to measure performance and prepare sales analysis reports in practice?
What is sales effectiveness?
Before you start to measure the effectiveness of your sales team, it is good to know the difference between effectiveness and efficiency.
For example, you can say that your sales team is more efficient if sales reps are able to make 30 phone calls more than a week before. However, an effective sales rep turns these 30 phone calls into 7 sales opportunities with great prospects for future revenue.
Efficiency means that you do the same things, but you use fewer resources. In the example above, time can be your resource because sales reps did more at the same time.
On the contrary, effectiveness means that sales reps work better and more effectively. And that leads to an increase in their sales performance. To measure progress in that way, you can check the number of effective meetings or phone calls.
“When it comes to efficiency and effectiveness, I would always start with effectiveness. I am interested in achieving a certain outcome. Only secondarily do I worry about achieving it as efficiently as possible” – said P. Kotler in an interview for B. Morris in 1995 r.
How to measure progress in sales teams?
Every sales analysis report can be based on different sales data and KPIs. Sales KPIs, Key Performance Indicators, help to measure the effectiveness. The definition says that a given key performance indicator is responsible for the effectiveness of a particular activity.
Key performance indicators are the factors that help determine the situation in a company. They use sales data to show if your organization achieves its goals (business or marketing) or not.
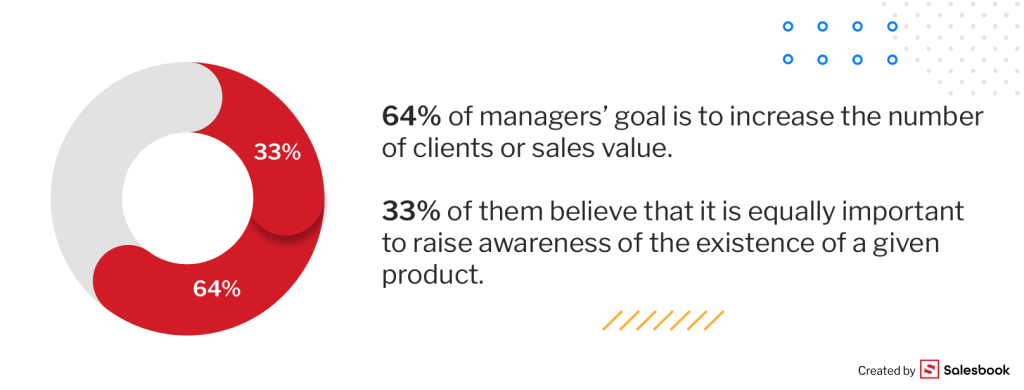
The goals of a company can be indirect or main. For example, according to “Marketer+” and the “European Marketing 2020 Survey”, 64% of sales managers set such main goals as increasing the number of customers or an increase in sales.
Only 33% of those sales managers are of the opinion that increased customer awareness of a given product is equally important.
Regardless of the chosen goals, the KPI definition says that the indicators’ role is to determine the effectiveness of a given organization’s activities.
Unfortunately, some companies choose KPIs on the basis of statistical data.
Why do they decide to choose that solution? Statistical data seems to be easier to measure and define. However, such decisions will not bring anything good in the future. Setting KPIs that way must backfire on a company.
How to choose Key Performance Indicators?
How to choose the right KPIs? There is no universal set of such indicators. Different KPIs will be suitable for different companies. They depend on the type of industry, size of the company, business goals, and the development of an organization.
Examples of marketing KPIs can be the average time of gaining a lead, the number of inquiries from the website, or customers gained as a result of marketing campaigns.
On the other hand, sales KPIs are, for example, net sales, net profit margin, the average time of a meeting, or the number of lost sales opportunities.
There are also financial KPIs that include profitability ratios or turnover ratios.
We have already written an article about setting KPIs, therefore, we mention only the most important facts.
A Key Performance Indicator and its features
If you take care of your sales reports and their reliability, you must remember that your KPIs should be SMART:
S – Specific – they have to be well-defined and related to the company’s current situation reflecting its development,
M – Measurable – every key performance indicator should have relevant value,
A – Attainable – KPIs should be set in relation to realistic business goals of your company (indirect or main – reflected in strategic KPIs),
R – Relevant – KPIs have to be tailored to your company’s needs and focused on key areas,
T – Time-based – metrics have to be achieved in a certain time, and you need to define time boundaries.
Examples of KPIs in sales
As we have mentioned earlier, a given KPI shows if the goal is about to be reached or not.
Sales analysis is very important because it is the foundation of essential business decisions. On the basis of historical data and current information, entrepreneurs can change strategic KPIs, enhance performance management, or even modify the whole sales strategy.
Examples of KPIs in sales are:
- conversion rate – the ratio between offers sent to clients and closed deals,
- average deal size – you can obtain an average deal size if you divide the turnover by the number of orders; you can also find the data in the average deal size report,
- sales cycle length – this information about the sales cycle shows how long it takes for a sales rep to close a deal; you can find this data by analyzing a sales pipeline,
- number of won and lost sales opportunities – those details about the sales process show you how many leads have been turned into customers, and how many clients you have lost (you can check in a lost deals analysis report),

- customer lifetime value (CLV) – this metric tells you about the total amount of money that a customer brings to your company by buying products,
- number of salespeople who reach sales targets, and track KPIs – this sales data shows the most effective salesperson in your sales team,
- number of new sales chances in a sales pipeline – the number of opportunities that have appeared in a given time,
- conversion rate in relation to the method of lead generation – this information shows how many leads gained from Google Ads or Facebook reach the sales pipeline,
- customer retention – it defines the ability of a company to maintain customers. It is very important because as Harvard Business Review reports, a company has to spend 35% more money to gain a new client than to maintain a current customer,
- customer acquisition cost – this is the money that you need to spend to gain new customers; often measured by a marketing team after a marketing campaign.

- lead response time – this KPI measures the amount of time your sales teams need to follow up with potential customers after their initial contact; you will find the exact data in a lead response time report.
Checking performance metrics and achieving goals leads to an increase in sales. If you want to track KPIs, generate a sales analysis report about an area of your particular interest. For example, your team performance analysis report, revenue report, churned customers report, or sales call report.
What is a sales analysis report (or a sales report)?
A sales report or a sales analysis report is a document that contains data relevant to salespeople. After all, it summarizes their activities. However, a sales report can also focus on various information that gives you the full perspective of the overall sales process.
Furthermore, sales reporting is also essential to the entire organization. Sales reports (or sales analysis reports) can show you the financial situation of a company, organizational problems, engagement of sales teams, the level of customer satisfaction, and their interest in your offer.
Sales reports can include different elements. For example: sales revenue, net profit margin, average sales value of a given product, contact rate on the basis of specific sales activities, or the level of effectiveness of employees.
The content of sales analysis reports depends on your company’s needs.
Why is it significant to create sales analysis reports?
- Sales analysis is important while reaching business goals and implementing a sales strategy. Every metric shows if a given KPI is attainable and goal – reachable.
- Daily sales reports, weekly sales reports, or monthly sales reports affect employee satisfaction and motivation. If you present and discuss sales results, your sales team knows sales volume and factors that affected it. You can also use KPIs to encourage salespeople to be more engaged. Sales reps satisfied with their work will be better sales leaders.

- A sales report that was generated by a modern sales analysis tool contains reliable data. It means that you can make important business and investment decisions on the basis of this.
- If you are not content with the KPIs that have been achieved, and a sales process is far from your assumptions, you can react at the right moment. Thanks to this, you are able to change your strategy, sales operations, or investments.
Sales reporting – how to do it well?
KPIs, data, sales trends, and other elements – sales reports can contain numerous information that is difficult to organize and analyze. It is demanding for salespeople, however, not only for them.
The truth is preparing a sales analysis report is challenging and time-consuming for everybody. It is even harder when you do it on your own. You have to take into account many elements such as:
- actual and complete data,
- thought-out structure of your sales report – it must be understandable for everyone,
- accessible form – you need to present metrics and information in an attractive way, sales managers and other employees who will get this sales report should not read long paragraphs and seek numbers that are not highlighted,
- defined time – you should present data in relation to a specific time, for example, by creating weekly sales reports, etc.
However, if you want to have complete sales reports, you cannot rely on quantitative data that are filled in by sales reps in Excel tables. You need to gain qualitative data as well. This data allows you to measure if a given sales meeting was successful. Of course, it is only an example of what you can know.

Why is qualitative data so relevant?
Imagine that a sales report shows that a sales rep is very active, makes a lot of phone calls, arranges many meetings, and talks to many clients. But what about the sales effectiveness?
This salesperson does not ask any significant questions to find out more about the client’s needs. As a result, your company does not record revenue growth.
This information can be gathered only by advanced reporting tools that can monitor sales from different angles. We have already written an article about how to measure the elements of sales that are probably impossible to measure. If you are interested in this topic, we advise you to read the article.
If you want to be certain that the data included in your sales reports are exact, check modern analyzing and reporting tools.
Sales reporting and sales automation
Salesbook is definitely this kind of tool. First of all, Salesbook gathers and analyzes both quantitative and qualitative data that a system collects during a sales meeting.
After every meeting, Salesbook prepares sales reports on the basis of gathered data. Salespeople do not have to type in and organize data manually in the system. Instead of this, they can automatically generate a specific report.
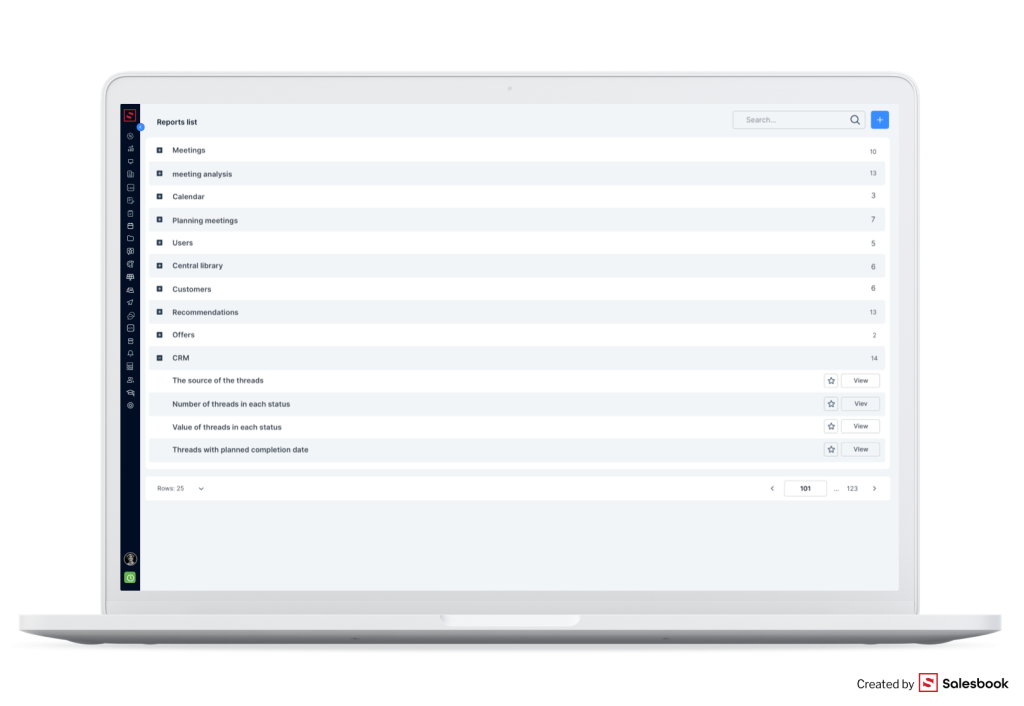
You can find all gathered information in the tab Reports, available in the Back Office. Among the defined ones, you can find the following reports on:
- sales analysis,
- sales activities of employees on the basis of their calendars,
- increase in customers,
- localization of sales reps,
- the number of offers created by specific salespeople,
- the source of sales chances,
- the number of contracts signed in a given time,
- sales value in relation to products,
- sales forecasts,
- KPIs that are presented in percentages.
You can also choose certain reports and add them to the tab Favorite reports.
A sales analysis report with Salesbook
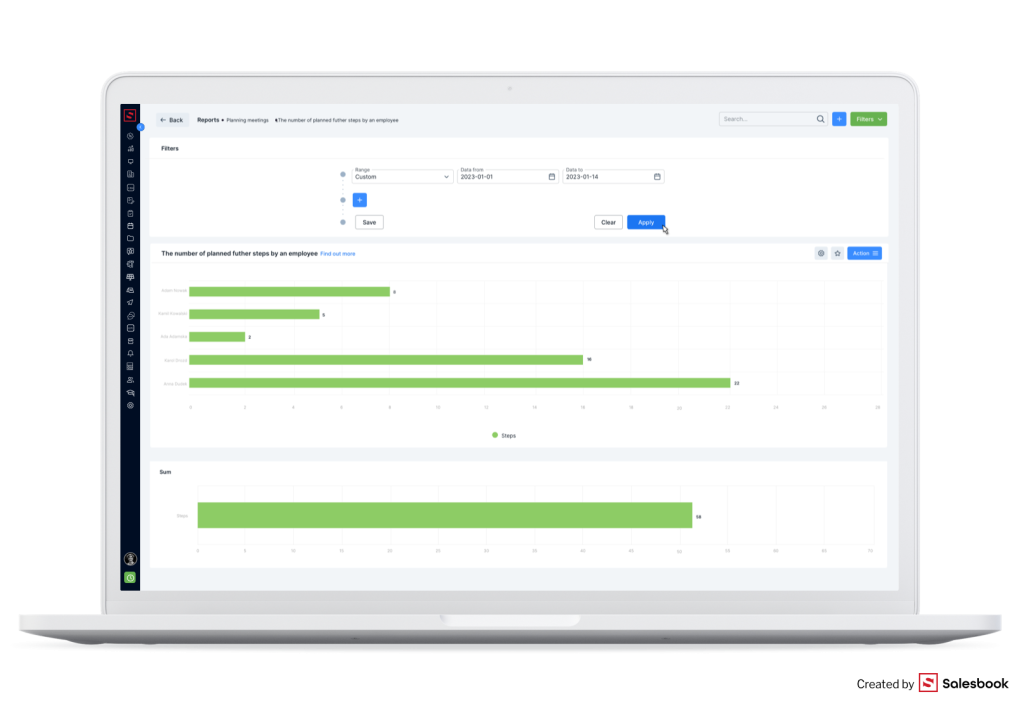
Salesbook helps analyze the entire sales process – from a meeting with a client to the sales value. Regardless of what report you generate, you will gain data presented in an attractive way. Below you can find examples of reports that you can generate.
Reports on sales meetings
Thanks to reports on sales meetings that you can generate in Salesbook, you have the bigger picture of the frequency of meetings with customers and their localization. Moreover, you gain information about:
- the number of meetings ended with signing a contract,
- the number of ineffective meetings,
- the average duration of a meeting,
- the reason for their interruption,
- how they are planned,
- the average time spent on discussing a product or service.
Reports on the effectiveness of sales reps
If you have reports on the effectiveness of sales reps, you gain knowledge about different aspects of your employees. You know, for example, which employees achieve the best results, or which salesperson has outstanding selling methods.
You will also know:
- metrics showing customers satisfaction and customer service, for example, the number of offers sent to clients, the number of follow-up e-mails or phone calls,
- activities that are the most effective,
- folders and materials that are frequently used by salespeople,
- how often sales opportunities change their statuses.

Sales analysis reports on customers
Generating reports on your clients allows you to know your customers, and prepare better offers for them.
What can you know from these reports?
- The sources of leads.
- How much time customers spend on different stages of a sales pipeline, and when you lose them.
- Products the most interesting to clients.
- The growth rate of customers.
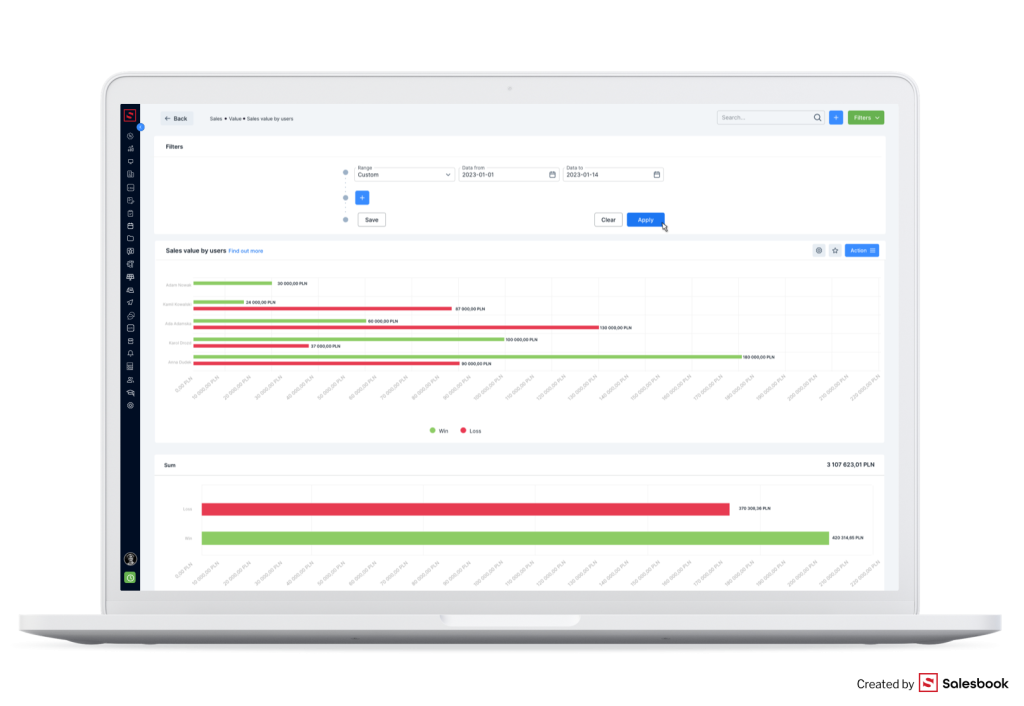
Reports on sales value
These reports show you which products sell better than others and what the average sales value is.
In reports you will find data on:
- value of won and lost chances,
- value of cyclical sales till the end of the year,
- number of sales chances in a given time,
- sales value in the time defined by you.
Sales analysis reports on KPIs
Salesbook has also KPI dashboards that show you all metrics chosen by you. Reports on KPIs can compare, for example, planned KPIs to achieved goals. Moreover, they give you information about which salespeople attained their goals and to what extent.
Summary
The reports presented above are just examples of sales analysis reports that you can generate with Salesbook. Apart from these documents, Salesbook offers reports on sales forecasts, threads’ analysis, offers sent to clients, ended campaigns, Call Center activities, or referrals from your customers.
Find out more about Salesbook’s advantages
Check what Salesbook can offer you. Try our free demo.


Test Salesbook for Free
Any questions? Feel free to contact us.
+44 203 807 0179help@salesbook.com sales@salesbook.com
Our Customer Success Team is available from Mon. to Fri. 9am - 5pm CET.
We support inquiries, processes of configuration and use of Salesbook app, as well as billing and technical issues.